Devpost
Participate in our public hackathons
Devpost for Teams
Access your company's private hackathons
Grow your developer ecosystem and promote your platform
Drive innovation, collaboration, and retention within your organization
By use case
Blog
Insights into hackathon planning and participation
Customer stories
Inspiration from peers and other industry leaders
Planning guides
Best practices for planning online and in-person hackathons
Webinars & events
Upcoming events and on-demand recordings
Help desk
Common questions and support documentation
Sort by:
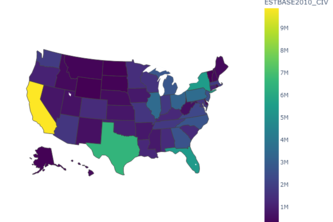
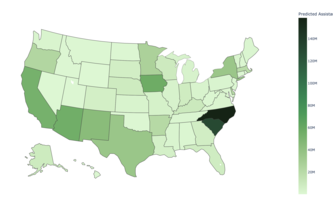
To successfully complete the project, we cleaned the given datasets, created data visualizations with different plots like bar plots, histograms, choropleth plots, etc and performed data analysis.
Using the given datasets, we determined gaps in national mammography coverage in order to help the FDA allocate hospital mammography certification funds.
A financial tool that uses statistical analysis and artificial Intelligence to visualize and forecast a business's income statement.
Optimize mammogram allocation for the FDA to maximize impact. Calculated expected deathrate per facility. Performed data visualization on US map
Predicting ideal collaborators given empirical renewable energy investment data using ensemble method with random forest and ARIMA
It's hard to visualize data, so we made something to do it for you!
Visualization deriving crucial trading insights
Our website uses data mapping to show the link between pollution and climate change, highlighting the impact of emissions on the environment in an interactive way.
A platform for stakeholders to analyse and mitigate any demand shocks caused by seasonal trends. Better serve your customers through optimal inventory planning with precise forecasting techniques.
UBC Botanical Garden is otherworldly terrain. Here are some teasers that don't give away too much: chloropleth maps and species.
Map based visualization app that lets the user geographically visualize the vehichle collisions that occurred in different parts of New York.
A monthly budget planner and tracker to attain savings goals.
Compute during green time!
I created a real-time oil price forecasting engine leveraging the AWS/DBnomics dataset, amongst other things
see the invisible
Quantifying effects of reducing food miles and recommending recipes to use leftover ingredients. We provide an interactive platform to augment global efforts to improve sustainability.
A fledgling space drilling engineering team that assembled itself to optimize resource recovery from 'eog resources' new exploratory asteroid field using PYTHON.
Use deep learning methods to transcribe audio into music notes with high accuracy
Chain pin clustering optimization in nanochips
Visualize the future of our generations with this sustainability dashboard, exposed via your friendly, neighborhood Chat bot, named "Sus".
An application that helps organizations manage it's people and their safety.
This simple Python app predicts the future of the stocks of the Dow Jones index.
Kompetitives Quartier-Ökoranking der Stadt St. Gallen zur Verbesserung des Recyclingverhaltens & Effizienz
Evaluate Robyn models and visualize the effect of marketing activity on media spend.