-
-
-
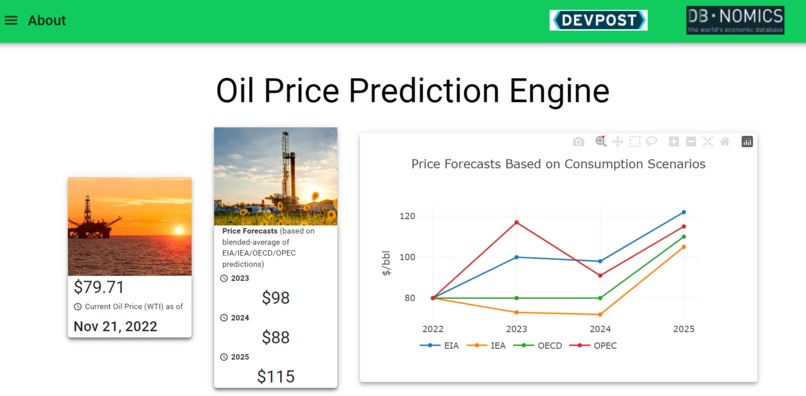
Real-time analytics based on live data feed


Inspiration
I have a passion for economic forecasting, energy, and coding. Before moving into full-stack, I was a principal energy analyst for a large research and consulting firm. As part of our quarterly oil price forecasts, the joke was that it there's one thing that's consistently right about it, it's that it's never right. In many cases, assessments were based less on science and observation and more on riding the political winds, 'gut feelings', etc. I wanted to create something that would not be based on 'gut feeling' or customer moods, but rather, indisputable truth.
What it does
What I've created is a scientific, real-time prediction engine that uses up-to-date supply and demand statistics, the latest costing models, and time series forecasting analysis to make superior oil price forecasts. It updates in real-time, and is accessible to anyone on the web.
For a more in-depth description on how it uses all of the information together, feel free to check out the Youtube video in this profile.
How we built it
Data analysis: Pandas, Scikit Learn (for seasonality, trend, residuals, etc.) Data visualization: Plotly and PlotlyJS Backend: Python Frontend: ReactJS, Material UI Excel for additional offline analysis Deployment: Render Data: EIA (DBnomics), IEA , OPEC, OCED, Rystad energy (for asset costing figures)
Challenges we ran into
Initially used Altair for visualization, before realizing it could not handle crossing over from Python to JS very well. Therefore we had to use Plotly/PlotlyJS. This worked much better, but note that Plotly has a few idiosyncracies as well.
Since the backend was built with Python and the front-end with React, there were some challenges in porting the data over since it meant converting from a Pandas Dataframe to a JSON to a Javascript array in order for Plotly JS to be able to handle the data. All of the data conversions represented significant time sinks and learning opportunities.
Also, this represents the second time I have used MUI to build an app's front-end. I like it a lot, but learning all the details did take a little bit of time.
Also, it should be noted that the AWS Rearc Dbnomics API doesn't actually return the requested data, but rather the metadata about the data set. Therefore, until this problem is addressed, I relied primarily on the DBnomics API directly to obtain the datasets .
Accomplishments that we're proud of
Getting everything to work and finally deploy! I learned so much and am excited to keep using these API's with AWS going forward.
What we learned
- Designing in MUI is ultimately superior to HTML/CSS/Bootstrap
- The Python backend / React front-end combo is pretty cool
- Making real-time predictions is more accessible than ever before due to the sheer number of tools out there (AWS API etc.)
- The more complicated your app is, the longer it takes to build and the harder it is to deploy.
What's next for Oil Price Prediction Engine
- Change the forecasting algorithm to better leverage monthly, as opposed to annual, data
- Clean the code, improve responsiveness, improve layout and graphics
- Promote the app within various energy , investing, and data science/ tech communities in order to drive usage
_*Note- In order to protect the IP of the proprietary algorithm and also due to time limitations, certain parts of the pricing algorithm have been removed from the Github codebase. However, I am more than happy to share the full codebase if requested.
Built With
- materialui
- plotly
- python
- react
- scikit-learn


Log in or sign up for Devpost to join the conversation.