Devpost
Participate in our public hackathons
Devpost for Teams
Access your company's private hackathons
Grow your developer ecosystem and promote your platform
Drive innovation, collaboration, and retention within your organization
By use case
Blog
Insights into hackathon planning and participation
Customer stories
Inspiration from peers and other industry leaders
Planning guides
Best practices for planning online and in-person hackathons
Webinars & events
Upcoming events and on-demand recordings
Help desk
Common questions and support documentation
Sort by:
In a democracy, we should have access to information about our leaders and progress on promises they made in an efficient and accessible way. Introducing trackmyleader.tech!
Expand your operations while maintaining a low carbon footprint.
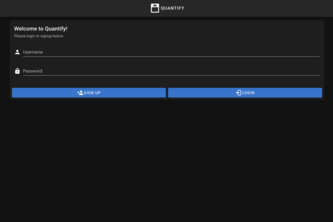
People don't like to weigh themselves at all, let alone daily. It's even worse seeing an outlier when you do. Quantify helps reveal real weight trends to make healthy weight management easy! :)
SquidBrainsCharts is a data visualization website that helps Hawaii State Open Data users to unlock the story behind datasets by answering users’ questions through dynamic data visualization.
Next time you go through airport security or to a doctor's appointment give feedback on the service by showing a gesture to a camera. Easy way to collect and see people's impressions of a service.
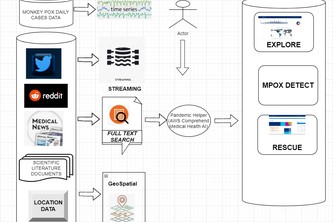
Pandemic prevention, preparedness, and response (PPR) using SingleStore and AWS Comprehend .EXPLORE -> DETECT -> RESCUE
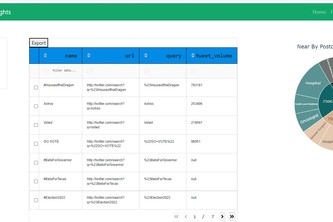
Real time Location Intelligence using FoursQuare and NLP .
Educating investors on evolving market volatility and conditions. Our goal is to empower individual investors to understand the role market volatility may have on investment risk-profiles
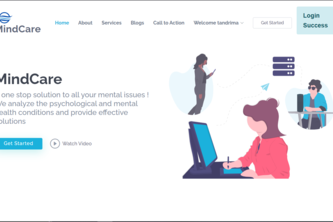
A one-stop solution to all your mental issues! We analyze psychological and mental health conditions and provide effective solutions
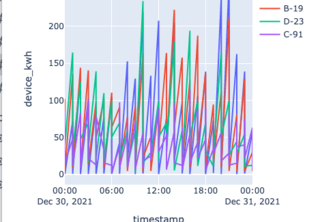
What if we can help businesses aggregate the monitoring and control of all of their IoT surveillance, security, lights, and appliances into 1 app while tracking data on power consumption and usage?
This project analyzes the Google ratings of schools across Brampton in order to raise awareness about issues which segregate the community and displays a map visually express the data.
Using pubChem's database we have created a open ended program which allows for one to model the electron clouds around atoms of any organic compound, given the name of the chemical.
To provide client Spiffy with relevant and useful information about their plant using data visualization.
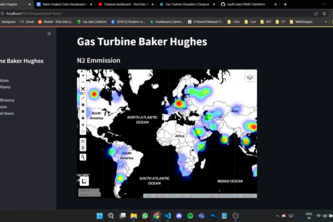
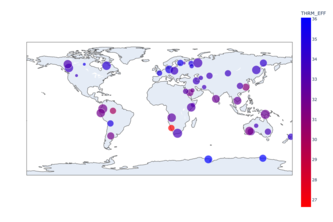
Our Gas turbine visualizer acts as the first step towards a monitoring sustainable energy future by understanding and visualizing where today's energy system's worst problems exist.
We benchmarked a commonly used Neural Network regression model with Bayesian Network model to predict the total expected COVID-19 cases and the scenarios of possible outcome given set of parameters.
This will make sense even if I don't
We made some cool discoveries about these gas turbine engines
An attempt at predictive analysis on datasets: "Crime Against Women(2001-2014)" and "Alcohol_consumption_Indian_State_2021_". We aim at ensuring that women - integral part of society, stay safe.
Do you feel bored and lonely on your fitness journey ?! We have the solution. We have built an AI app that helps you to create your regime and enjoy wellness competition with other fitness hackers.
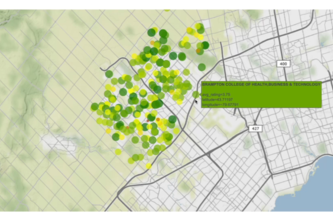
A tool to combine datasets to generate green space suggestion heat map in cities.
This app will get you updated on all the locations and people impacted by climate change and give you interactive data visualizations in order to preserve our home, Earth.
Want to see interactive plots to represent International COVID-19 Cases Data? This project contains 6 plots to help you do so!
Have you ever looked at people getting rich out of no where with a dead-end job? Well that might because of stocks! You can get rich fast with our highly-accurate stock prediction service!