-
-

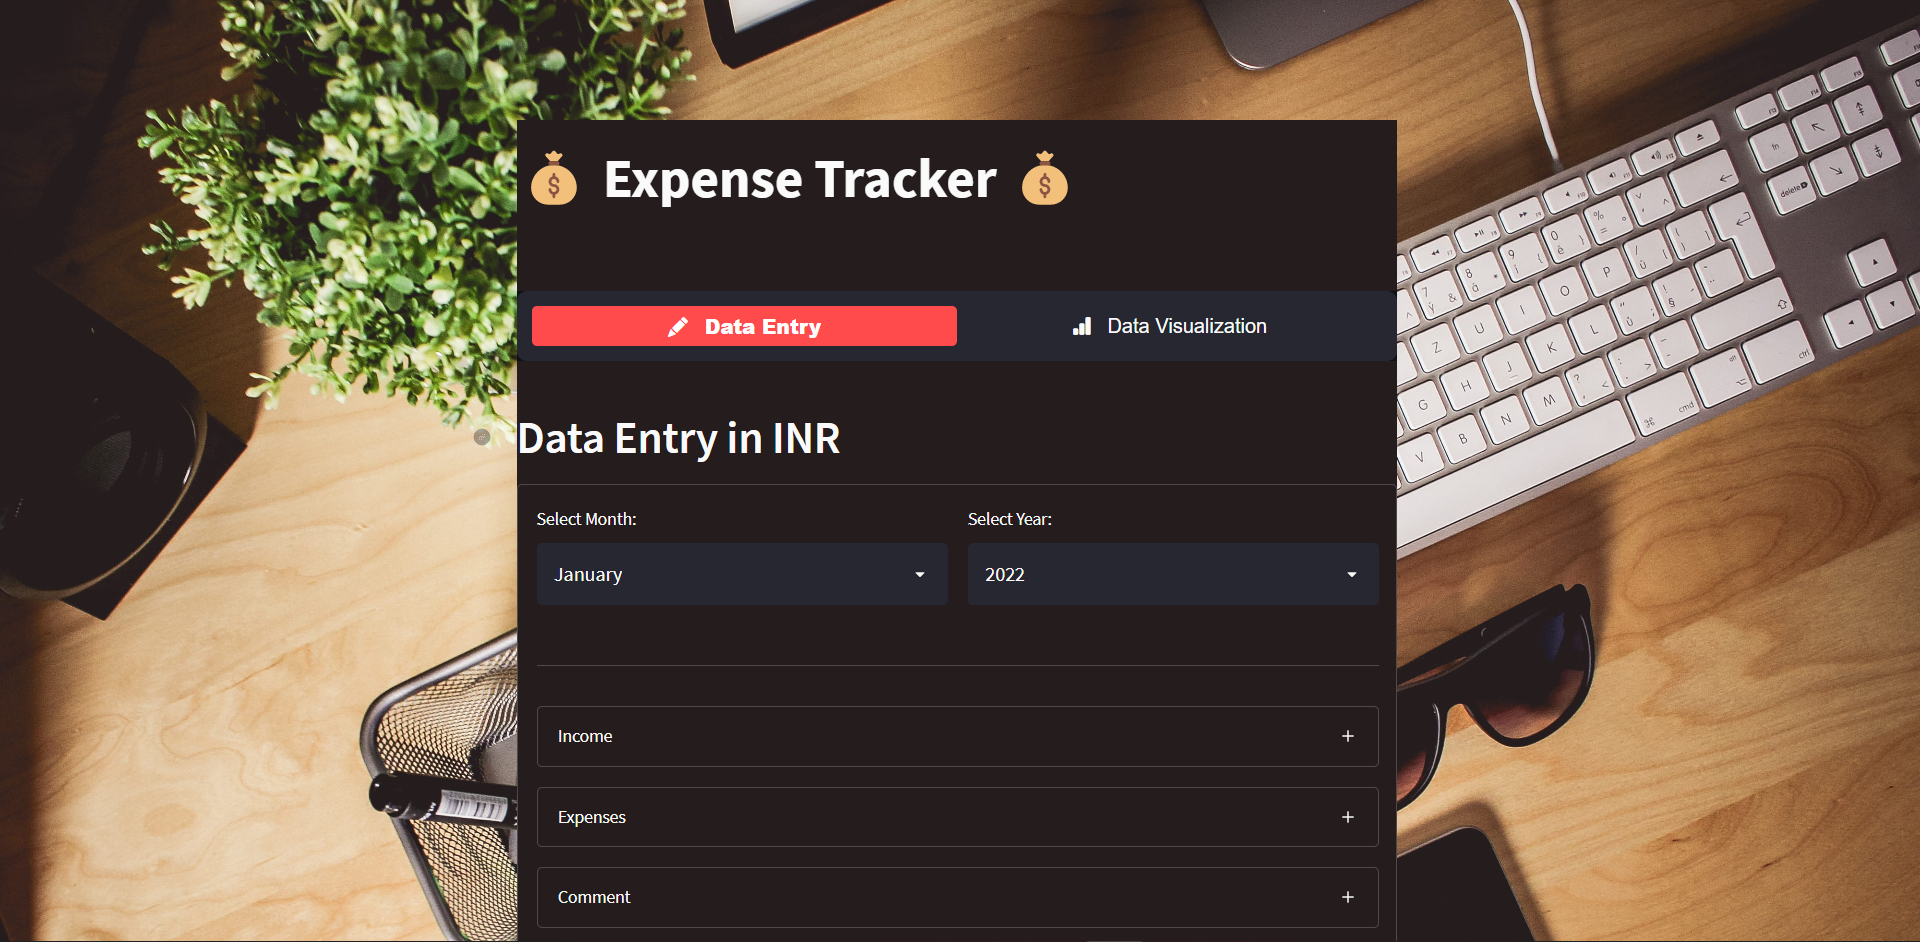
Home page
-
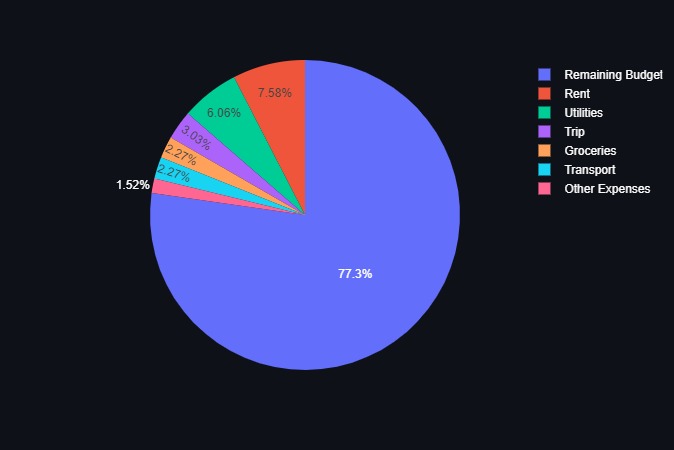
pie chart
-
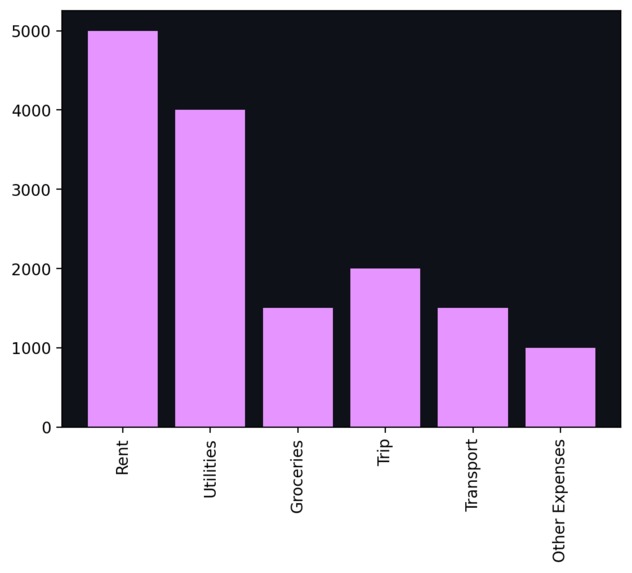
bar graph
-

sankey chart


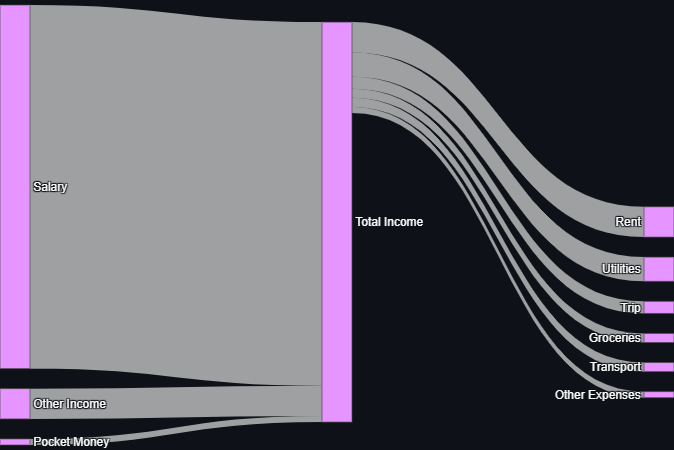
Inspiration
I want to make an app that not only track my monthly expenses but also give me statistical information in graphical format.
What it does:
It keeps track of monthly spendings and store the information in Mongo dB Atlas database and then visualize it in graphical format.
How I built it:
The whole app is made using Python with different packages. Packages used: streamlit streamlit_option_menu plotly matplotlib pymongo
Challenges I ran into:
I have never used mongodb atlas as a database, So that's a challenge for me.
Accomplishments that I'm proud of:
I am proud that I have participated in this hackathon after long period of time. Like previously I have participated in 2020 MLH local hack day. I am thankful for the whole MLH community for giving me this opportunity.
What we learned
I have learned diffrent python packages that I am not aware of, and I also learned about Mongodb Atlas database,
What's next for Expense Tracker
These are some ideas that can be implemented in myapp for future: Add user authentication service Sentiment analysis based on spendings Health analysis based on type of food Financial forecast for next year

Log in or sign up for Devpost to join the conversation.