-
-
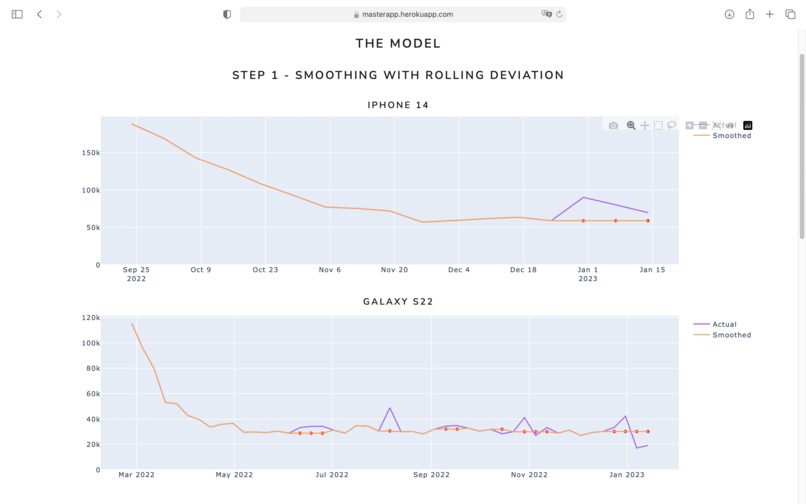
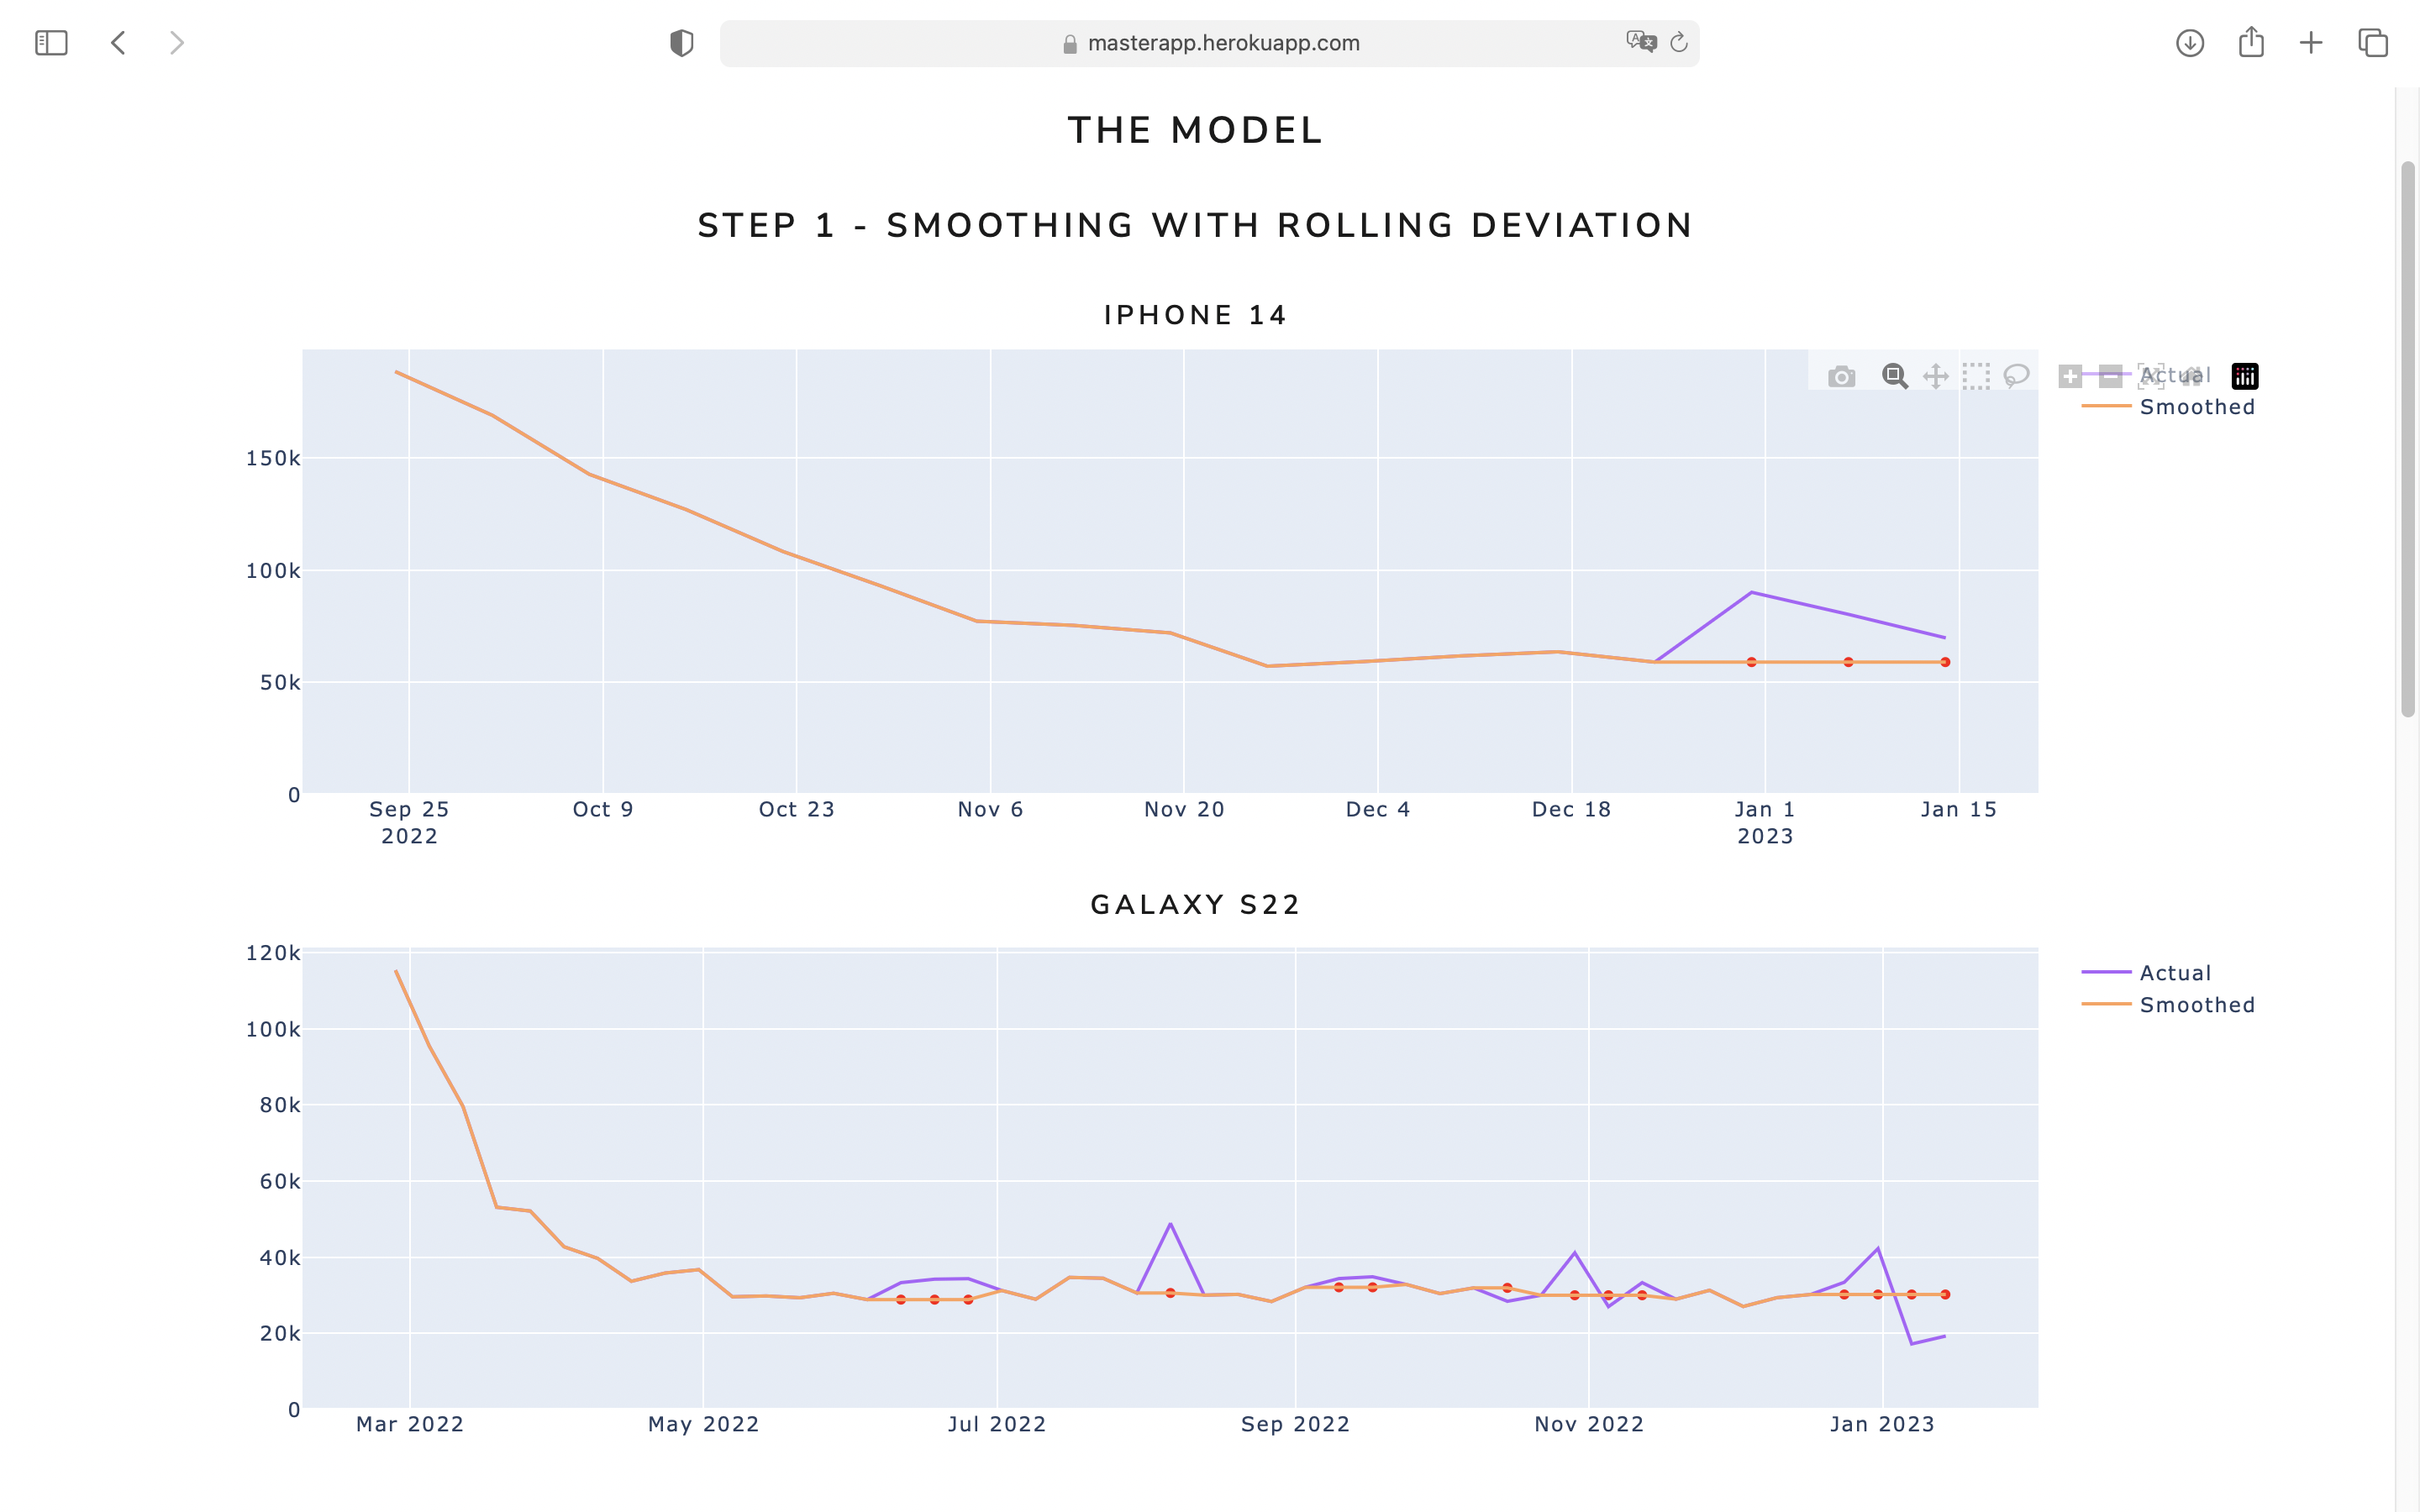
Smoothing with Rolling Standard Deviation
-
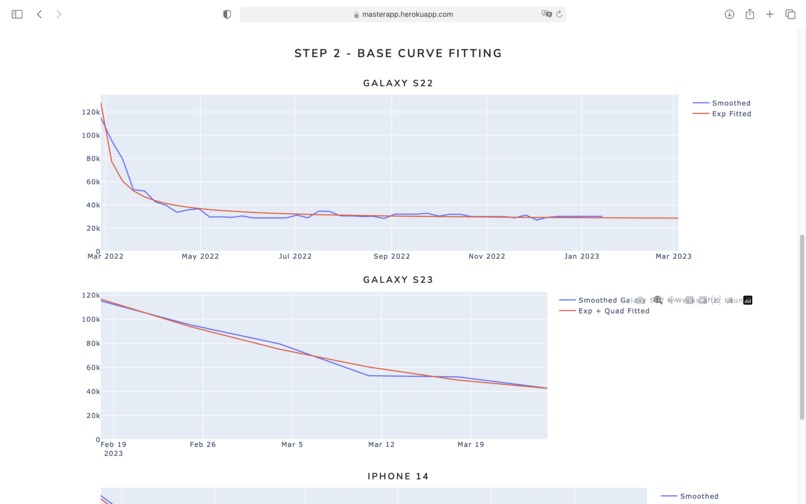
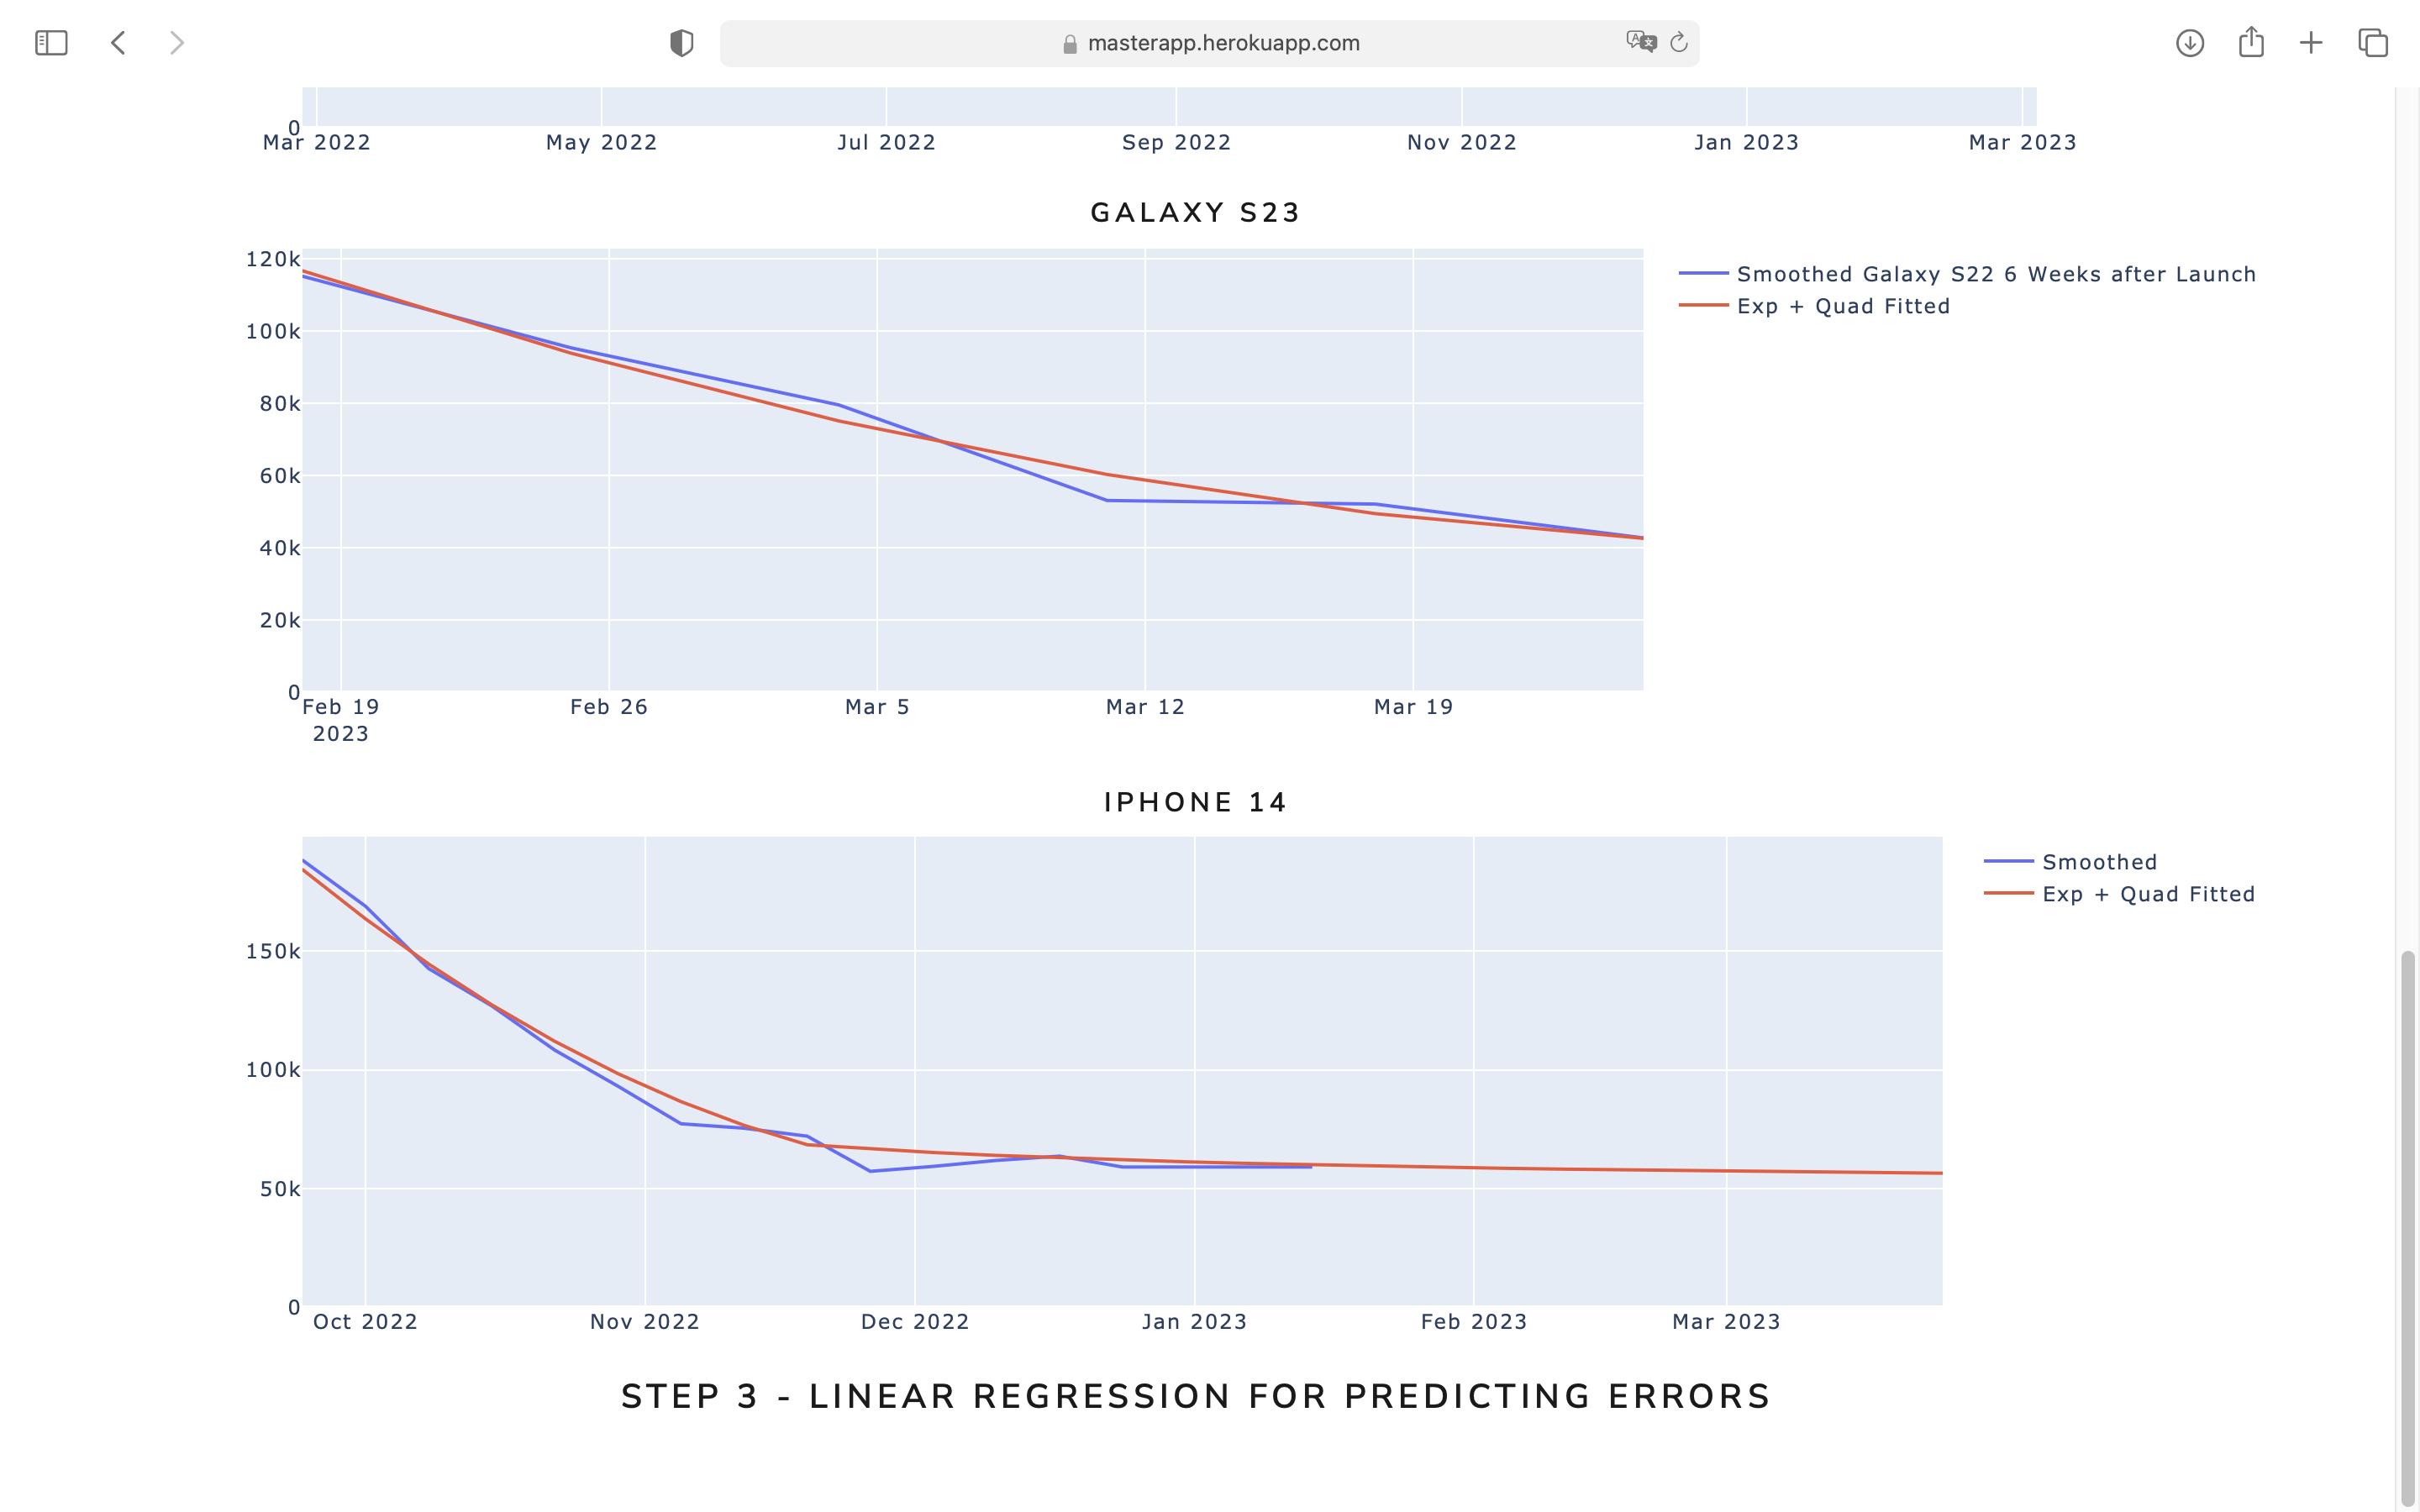
Base Curve Fitting 1/2
-
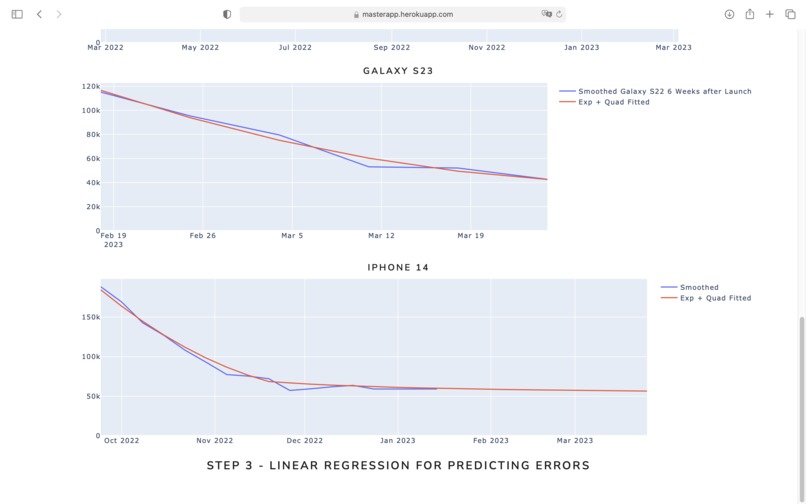
Base Curve Fitting 2/2
-

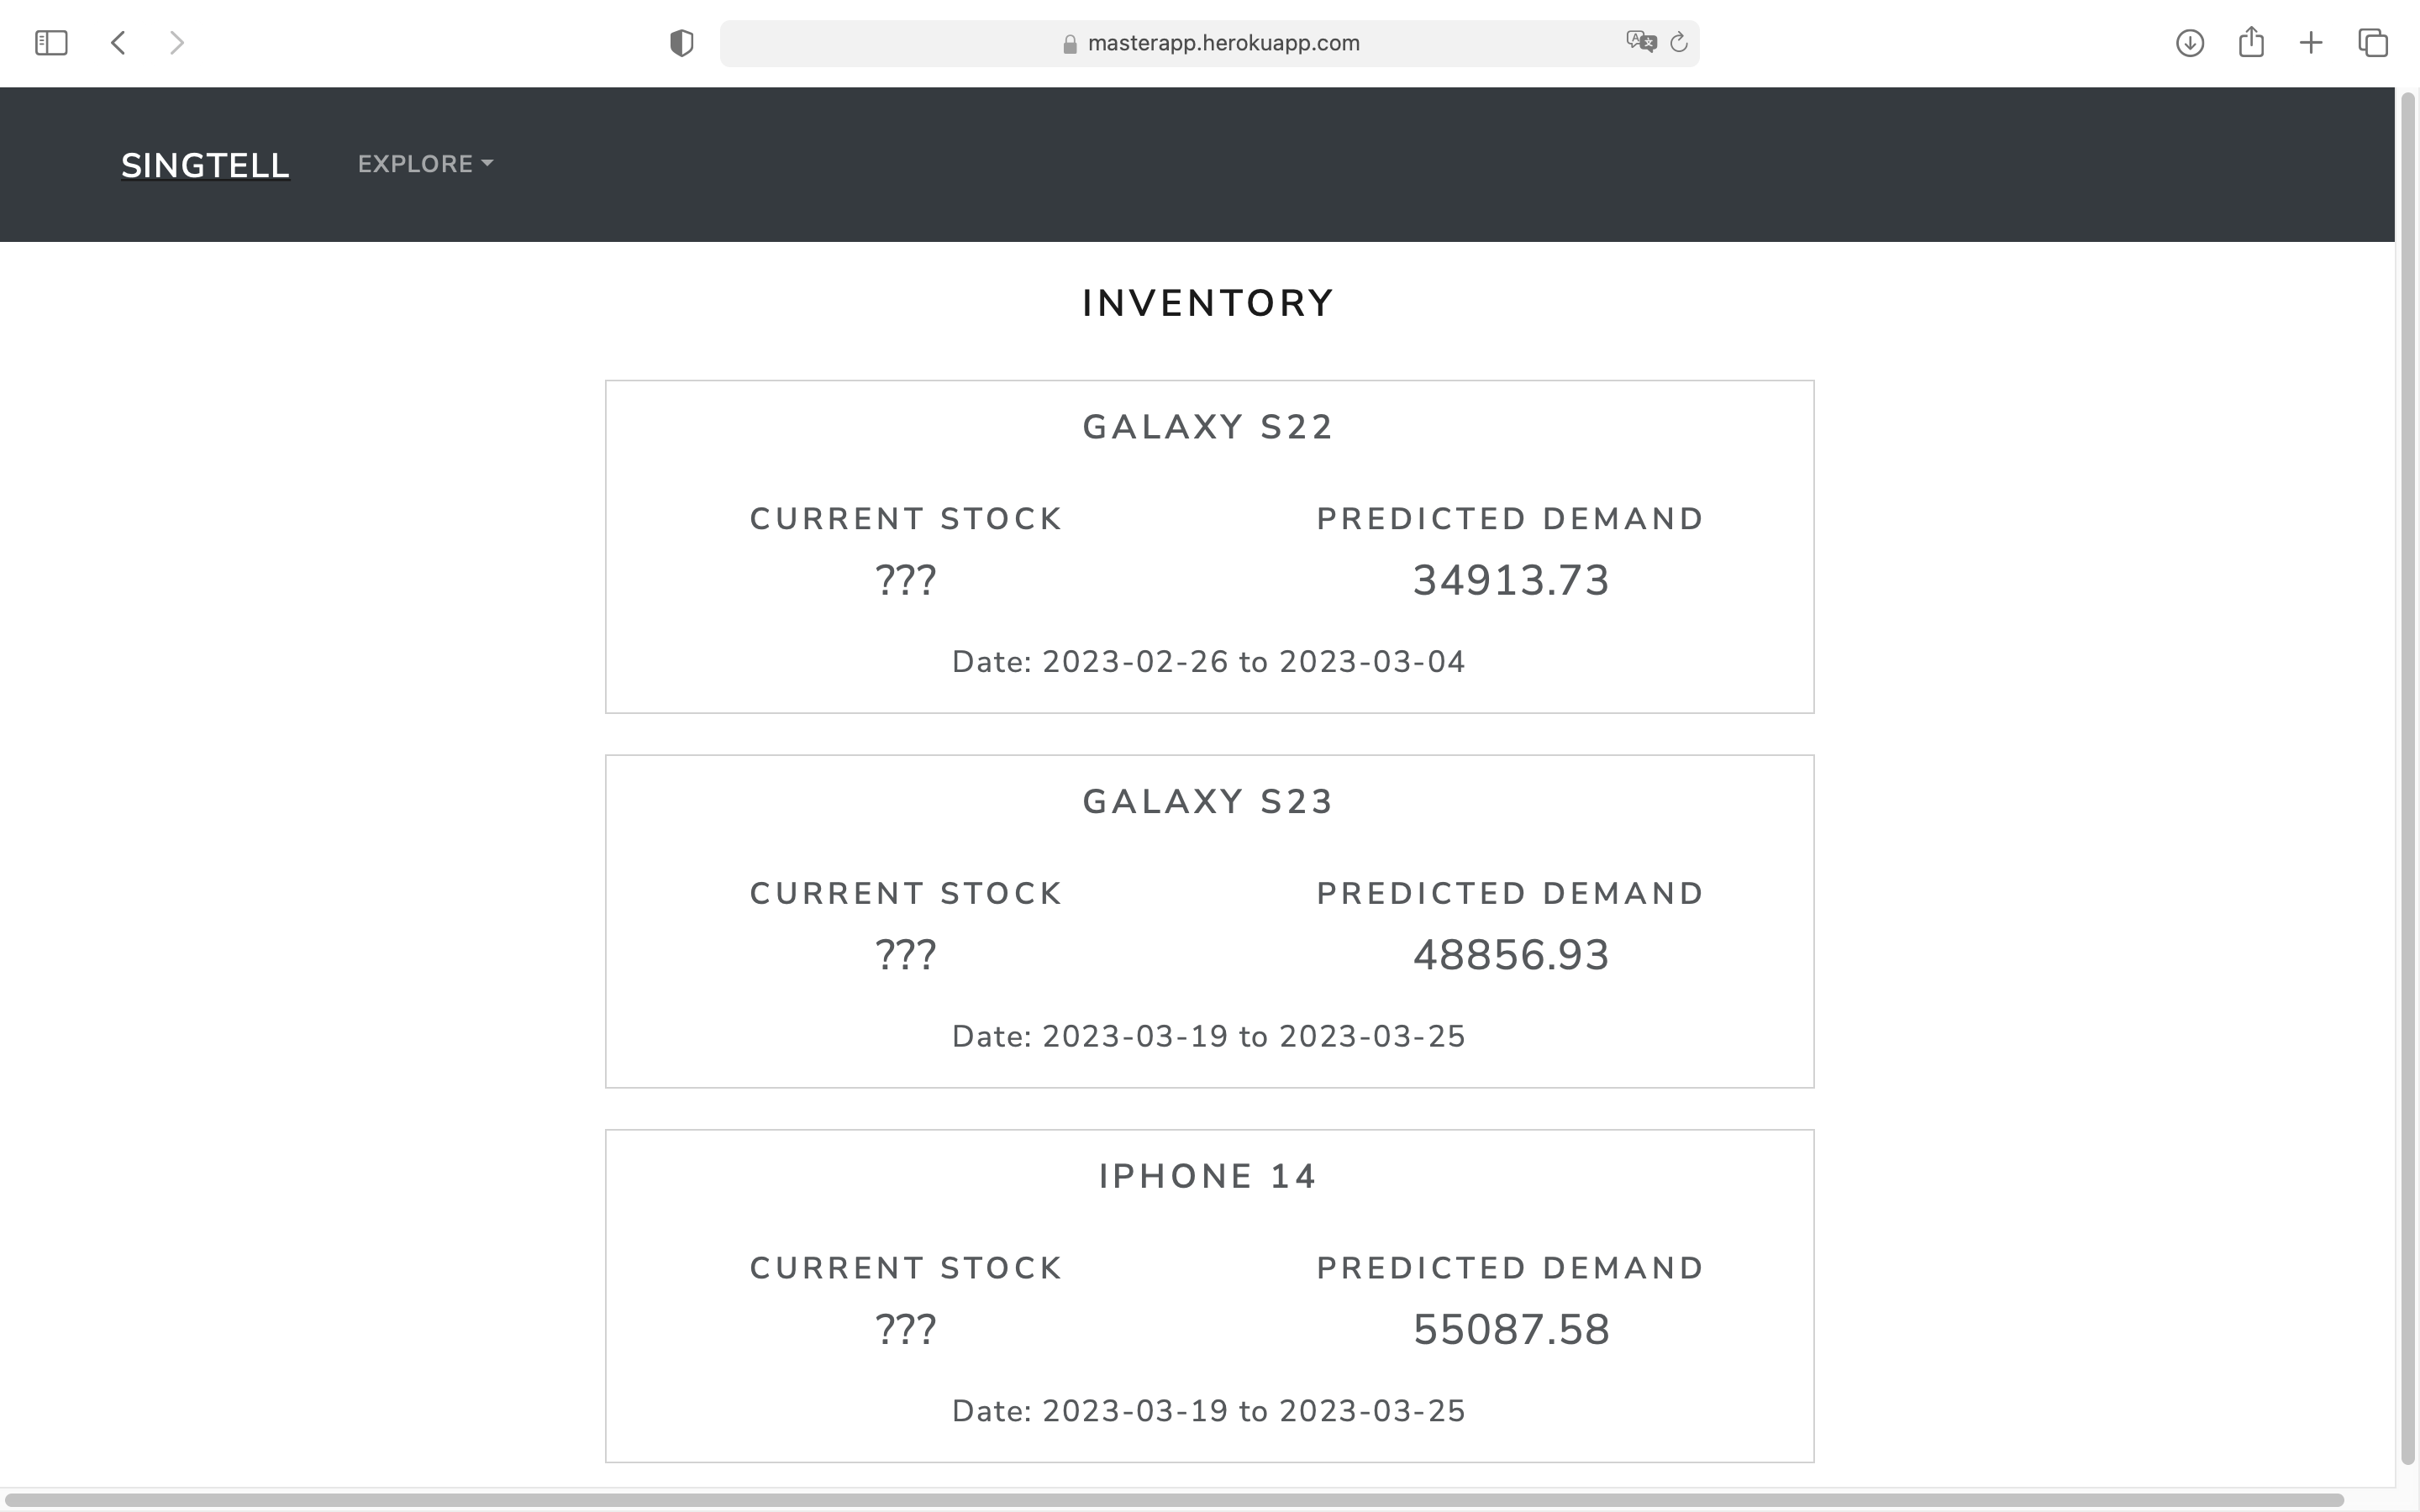
Inventory Interface

Inspiration
What served as our main inspiration was the wave of incoming analytic applications that we have seen blossom around us. Analytics can be implemented in almost anything that we can think of. When we saw this opportunity in front of us, we could not pass up this chance to apply what we've learnt and channel it into developing productive systems that can be applied in the working world.
What it does
Our system and dashboard allows its users to monitor the available stock of mobile phones ready for sale. Combining this with our system's analytic capability, we would be able to have a bigger and clearer picture when it comes to how our current inventory stands up to the potential demand predicted by our system. Our robust algorithm forecasts income demand 10 weeks in advance, by incorporating holiday patterns,
How we built it
To begin developing our model, we started off by visually identifying the behavioural patterns which existed within the data. As we discovered more concrete patterns of the data, we developed an integrated model involving:
Our primary focus was to perform time-series analysis to forecast errors which will serve as noise for our trendline. As our baseline trend, we used the Exponential Smoothing curve to model demand forecasts referencing historical patterns. Our team initially experimented with the ARIMA time-series model, but observed that it overfits. We then incorporated Ridge Regression to model the errors between the baseline and the actual values.
ARIMA models (forecasting errors) Ridge regression (forecasting errors) Exponential smoothing (baseline) Dash for Dashboard Inventory system in Dashboard
Challenges we ran into
One of the main challenges that we ran into was the lack of data. We could not get a clear view of the long term ups and downs of the business. We also could not establish long term patterns as we only had a window of one year to work with. We were limited to analysis within the year of 2022 and had to settle for algorithms that take advantage of patterns within the year itself.
Accomplishments that we're proud of
Despite the 48 hours tight deadline and ongoing external commitments, our team are proud to not only have developed a functioning demand forecasting model, but also successfully built an interactive dashboard using Dash, and hosted our project on Heroku.
What we learned
In spite of the challenges, we are grateful for this opportunity to work together as a team, and leverage on each individual’s strengths to tackle this challenge. More in-depth, we learnt how to apply ARIMA time-series into forecasting demand for inventory stock-taking based on historical levels.
What's next for To the Stars
We aspire to be able to compete in the finals in the hope that we catch SingTel’s eye and receive the opportunity to increase the scale and efficacy of our project. With further guidance, resources, and data, we would be able to develop more advanced predictive techniques to contribute to their booming business model.

Log in or sign up for Devpost to join the conversation.