-
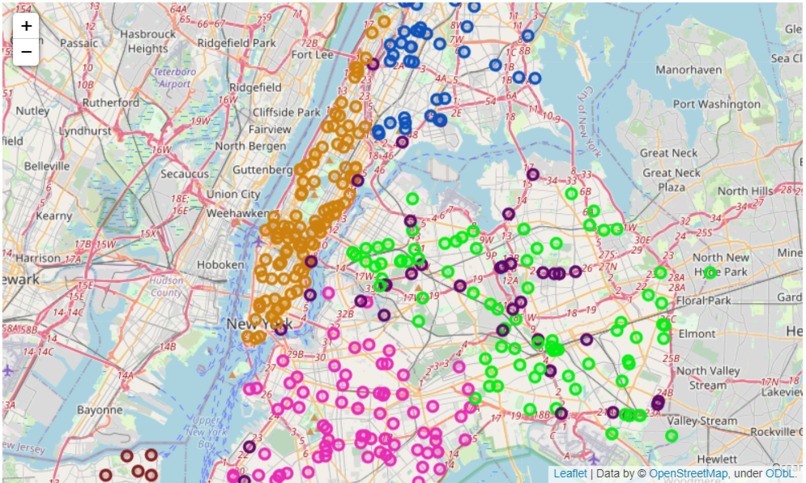
Sample image of Folium map result
-
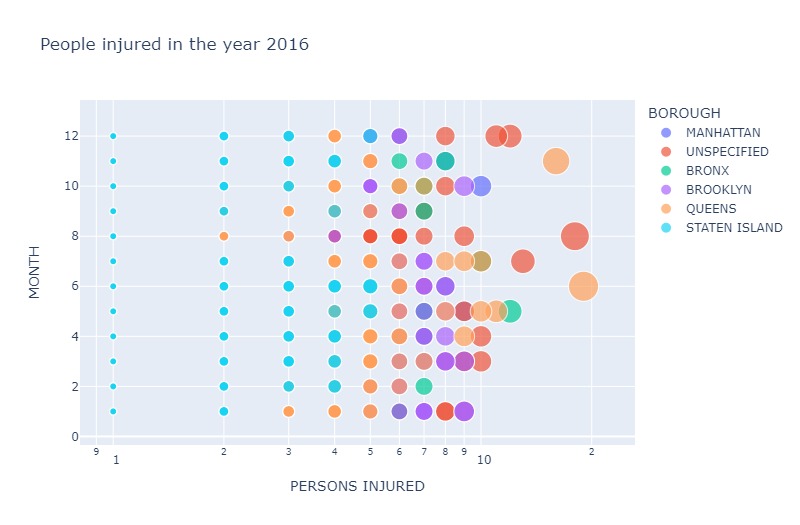
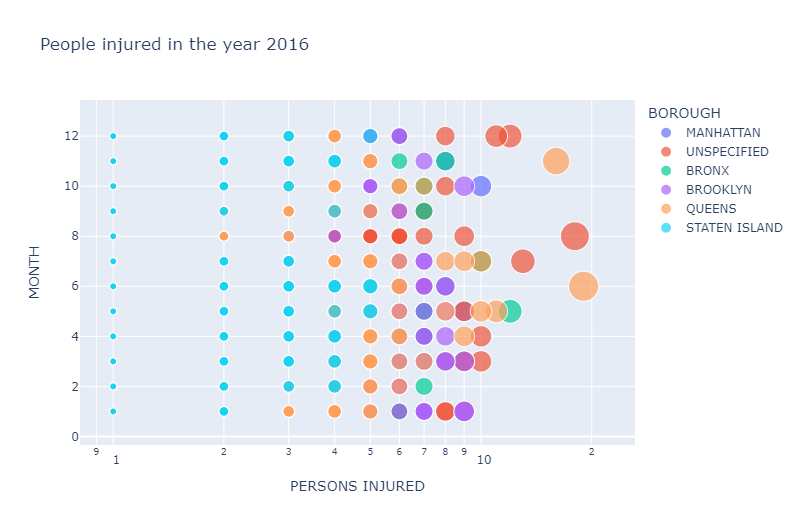
Sample plotly plot (bubble) representing data
-
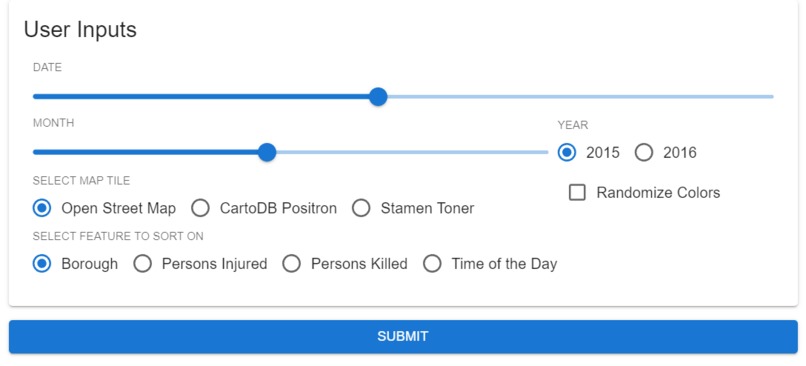
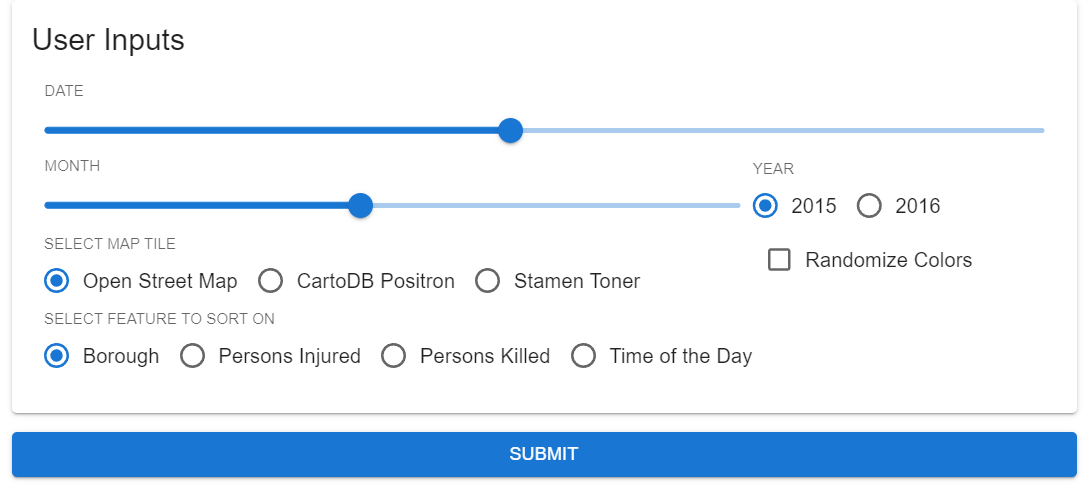
Input screen of app made with MecSimCalc

Inspiration :
Everyone cherishes New York City. Nobody enjoys vehicle accidents. Why bother looking at collision data? Well, reality is reality. Road safety is a vital subject that affects everyone's daily lives. It's unavoidable, and more often than not, a life-or-death circumstance. As a result, it is critical to examine past collision history data and see what we can learn from it to help better prevent and/or avoid collisions in the future.
What it does :
- From a dataset of 326448 instances of vehicle collision, it narrows down data to the selected date.
- Takes map-based input from the user to let them customize the map their own way.
- Gives the user an option to randomize the colors used on the map instead of using the default pallette.
- And finally, it allows users to sort the markers based on their selected features.
How we built it :
- We first took the data from the Kaggle Dataset and then performed data pre-processing where we handled missing values, dropped unnecessary columns and curated new columns from the existing ones.
- We performed EDA (Exploratory Data Analysis) on the data at hand and visualized it using several Plotly plots which can be found here.
- Then we started designing the layout and inputs for the app and began using them to narrow down the data according to the date selected by the user.
- Once the data was filtered, we began working on the folium map which consisted of user-selected tiles and CircleMarkers representing the instances of Vehicle Collisions.
- We customized the markers further by designing a table for the marker popups (which appears upon clicking on any of the markers). This part of customization was done using HTML.
- Once the map and its markers were ready, we wrote two functions for generating a color pallette. One was randomized and the other was set manually.
- The markers were then sorted on the basis of the feature selected by the user and colors were assigned from the color pallette to each of the categories present in the data for the selected feature.
- Lastly, the output was written to be displayed on the MecSimCalc app and after necessary previews and edits, the app was published on the platform.
What we learned
- From the technical point of view, we learnt how to develop and manage a MicSimCalc application.
- We also learnt how to use python libraries like Folium inside the MecSimCalc platform.
- Apart from that we also got a chance to expand our knowledge in the field of Data Visualization and explore more ways of working with data.
- Overall, this project allowed us to learn more about the frequency of vehicle collisions in a particular duration of NYC and it says a lot about the need for more safety and care for individuals.

Log in or sign up for Devpost to join the conversation.