Inspiration
Breast cancer is the most common cancer in women in the U.S. and is second to only skin cancers. Statistically, 1 in 8 women will get breast cancer in their lifetime, and the most effective way to prevent deaths is to detect and treat it early. A mammography is a method used by hospitals to detect breast cancer; However, not all hospitals in the U.S. offer mammograms because of a lack in equipment and training, which has created gaps in hospital mammography coverage across the U.S. In our challenge, the FDA would like to know the nationwide gaps in coverage in order to best allocate their funding.
What it does
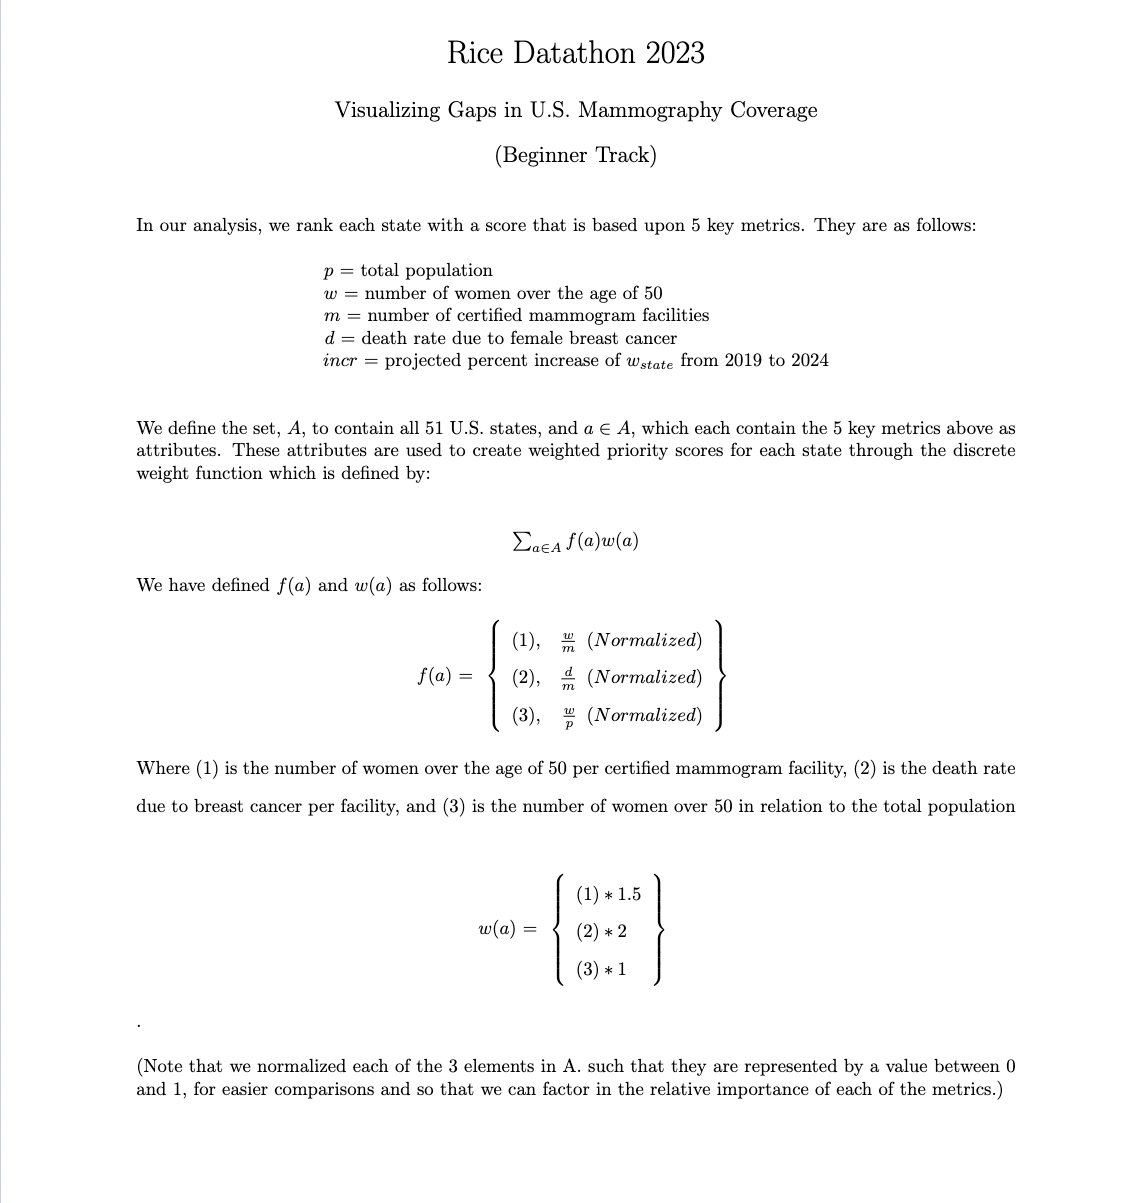
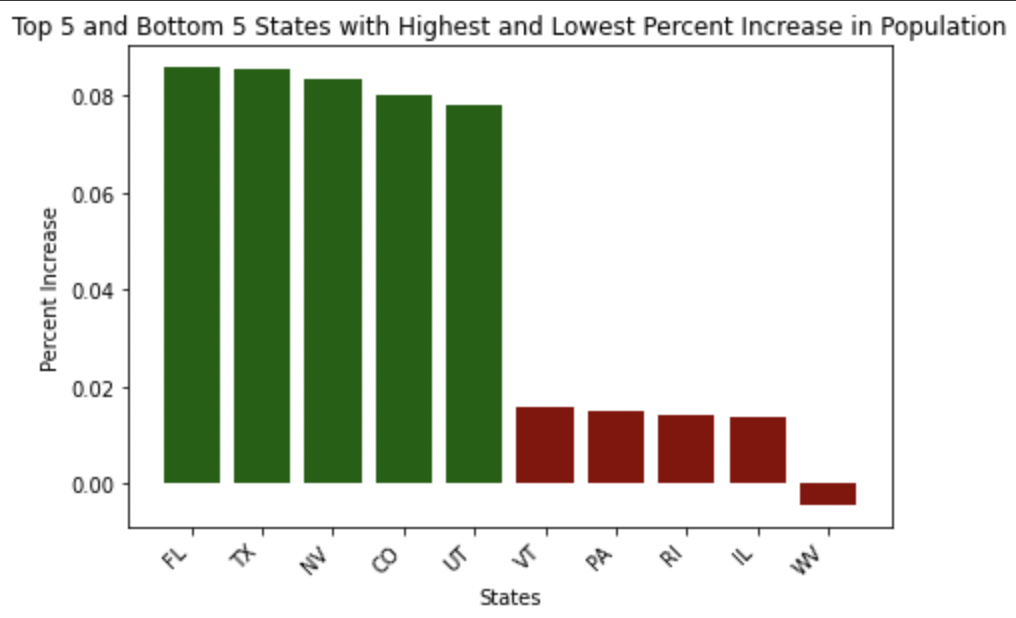
Our model uses population, which is women above the age of 49, per facility, breast cancer mortality rates per facility, and percent increase over 10 years, calculated for all 50 states to determine where there are gaps in coverage. Our model weighs these three factors differently to identify the states where more certified facilities are needed to treat the surrounding population most susceptible to breast cancer.
How we built it
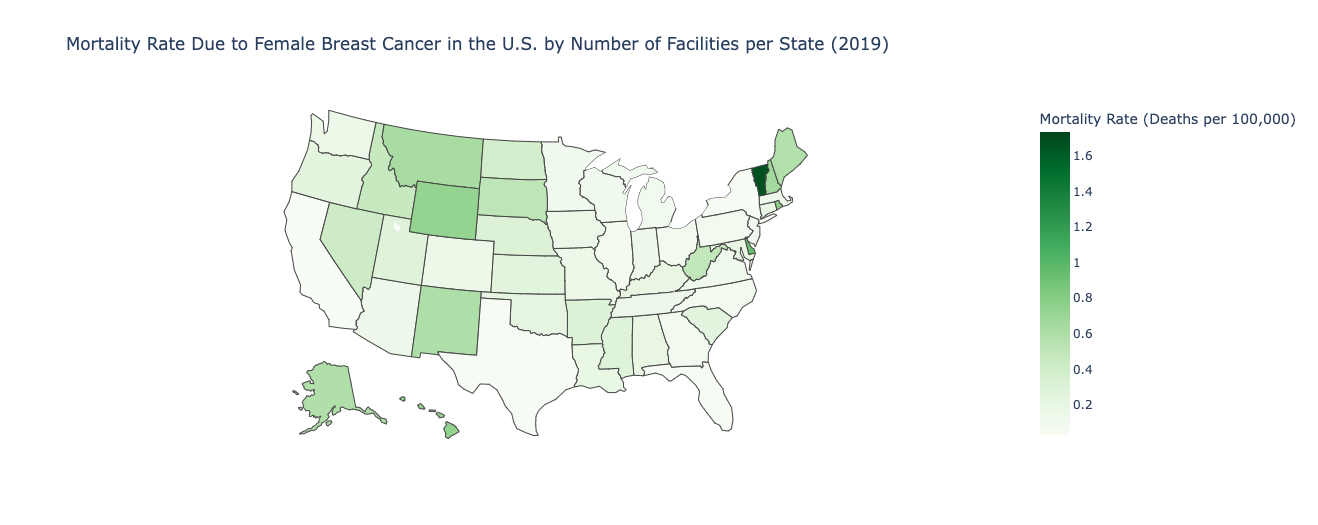
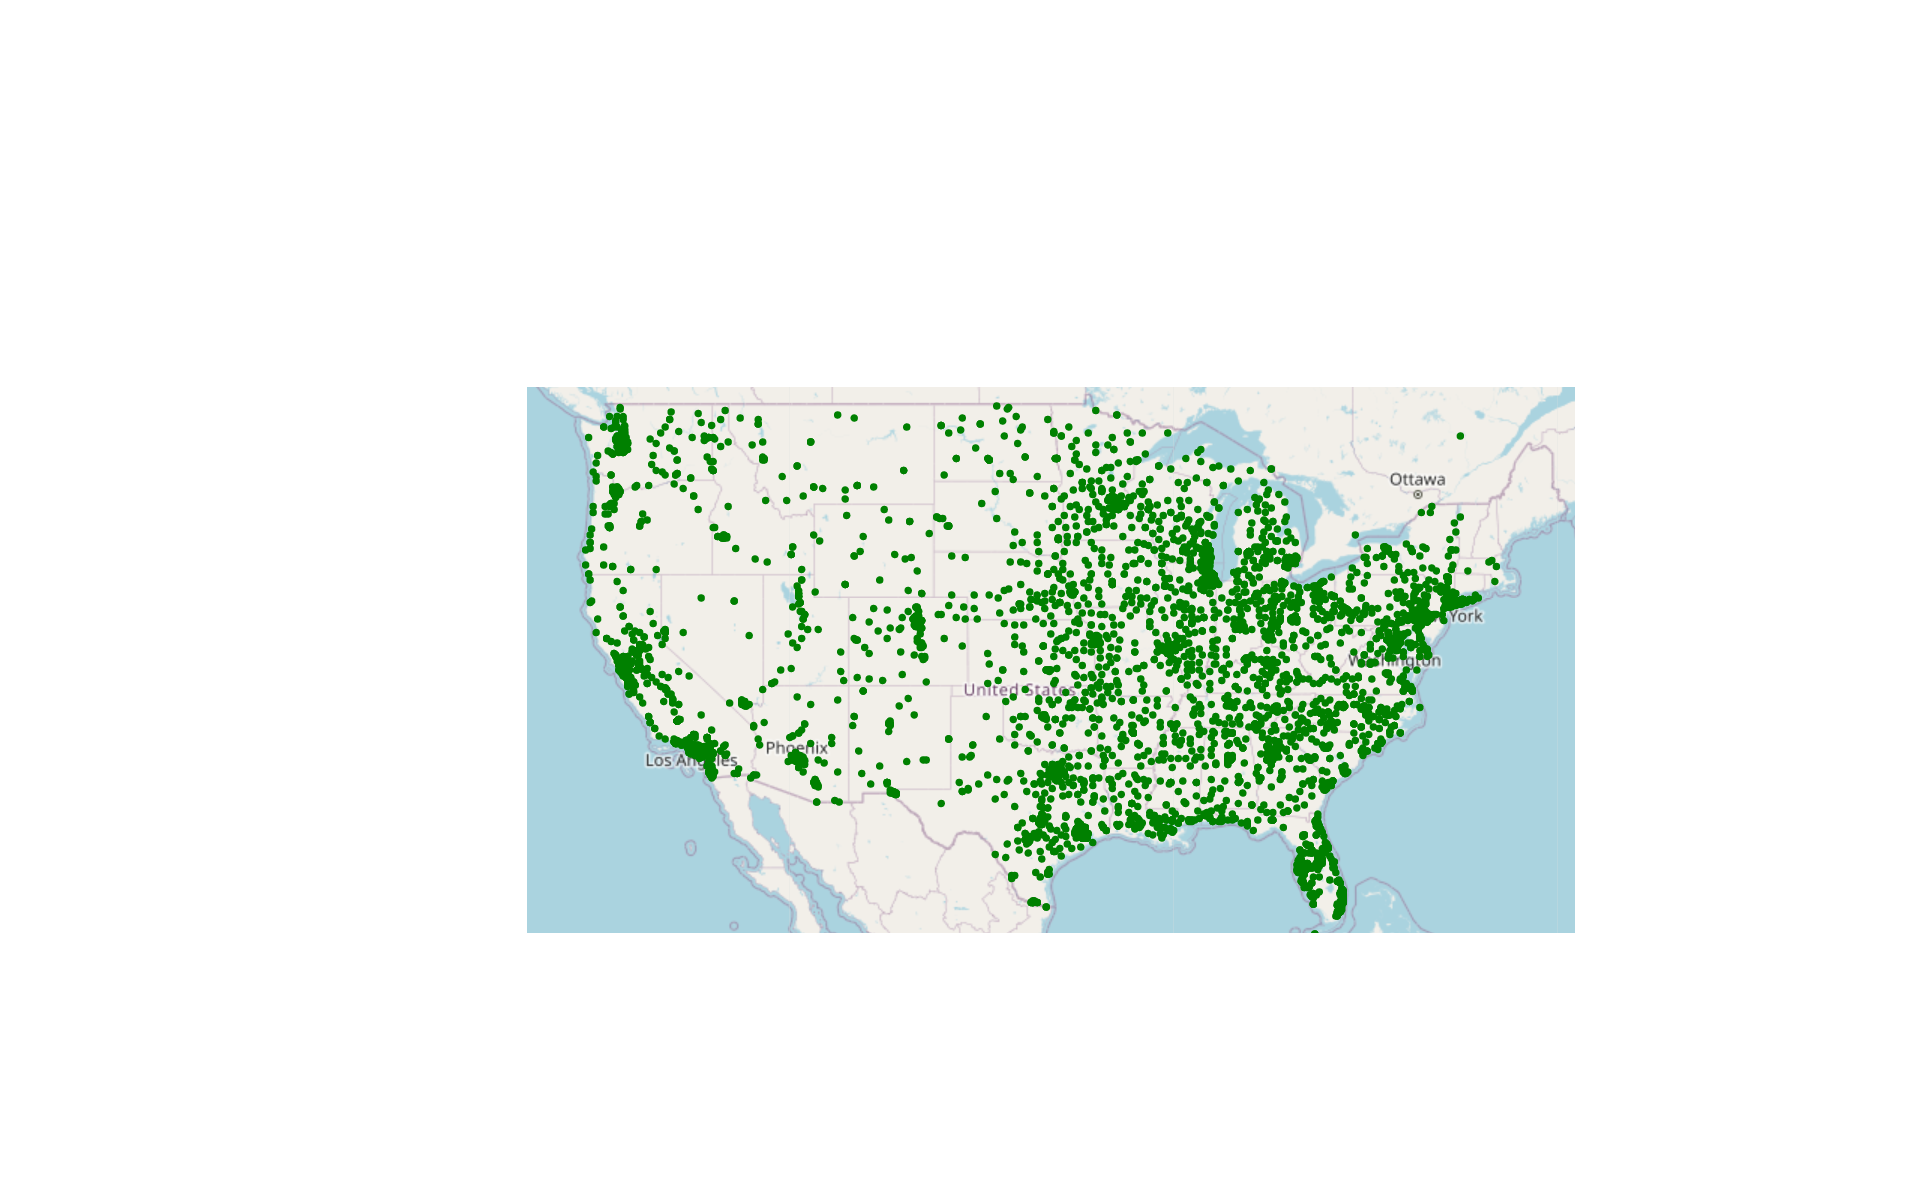
We started by cleaning the first dataset in order to plot all the zip codes of hospitals that offer mammograms. Then we made a state-by-state analysis of mortality rates per facility using an outside dataset. Next we calculated the growth rate of high-risk groups using a linear regression per state to predict which states would have to serve a growing population.
Challenges we ran into
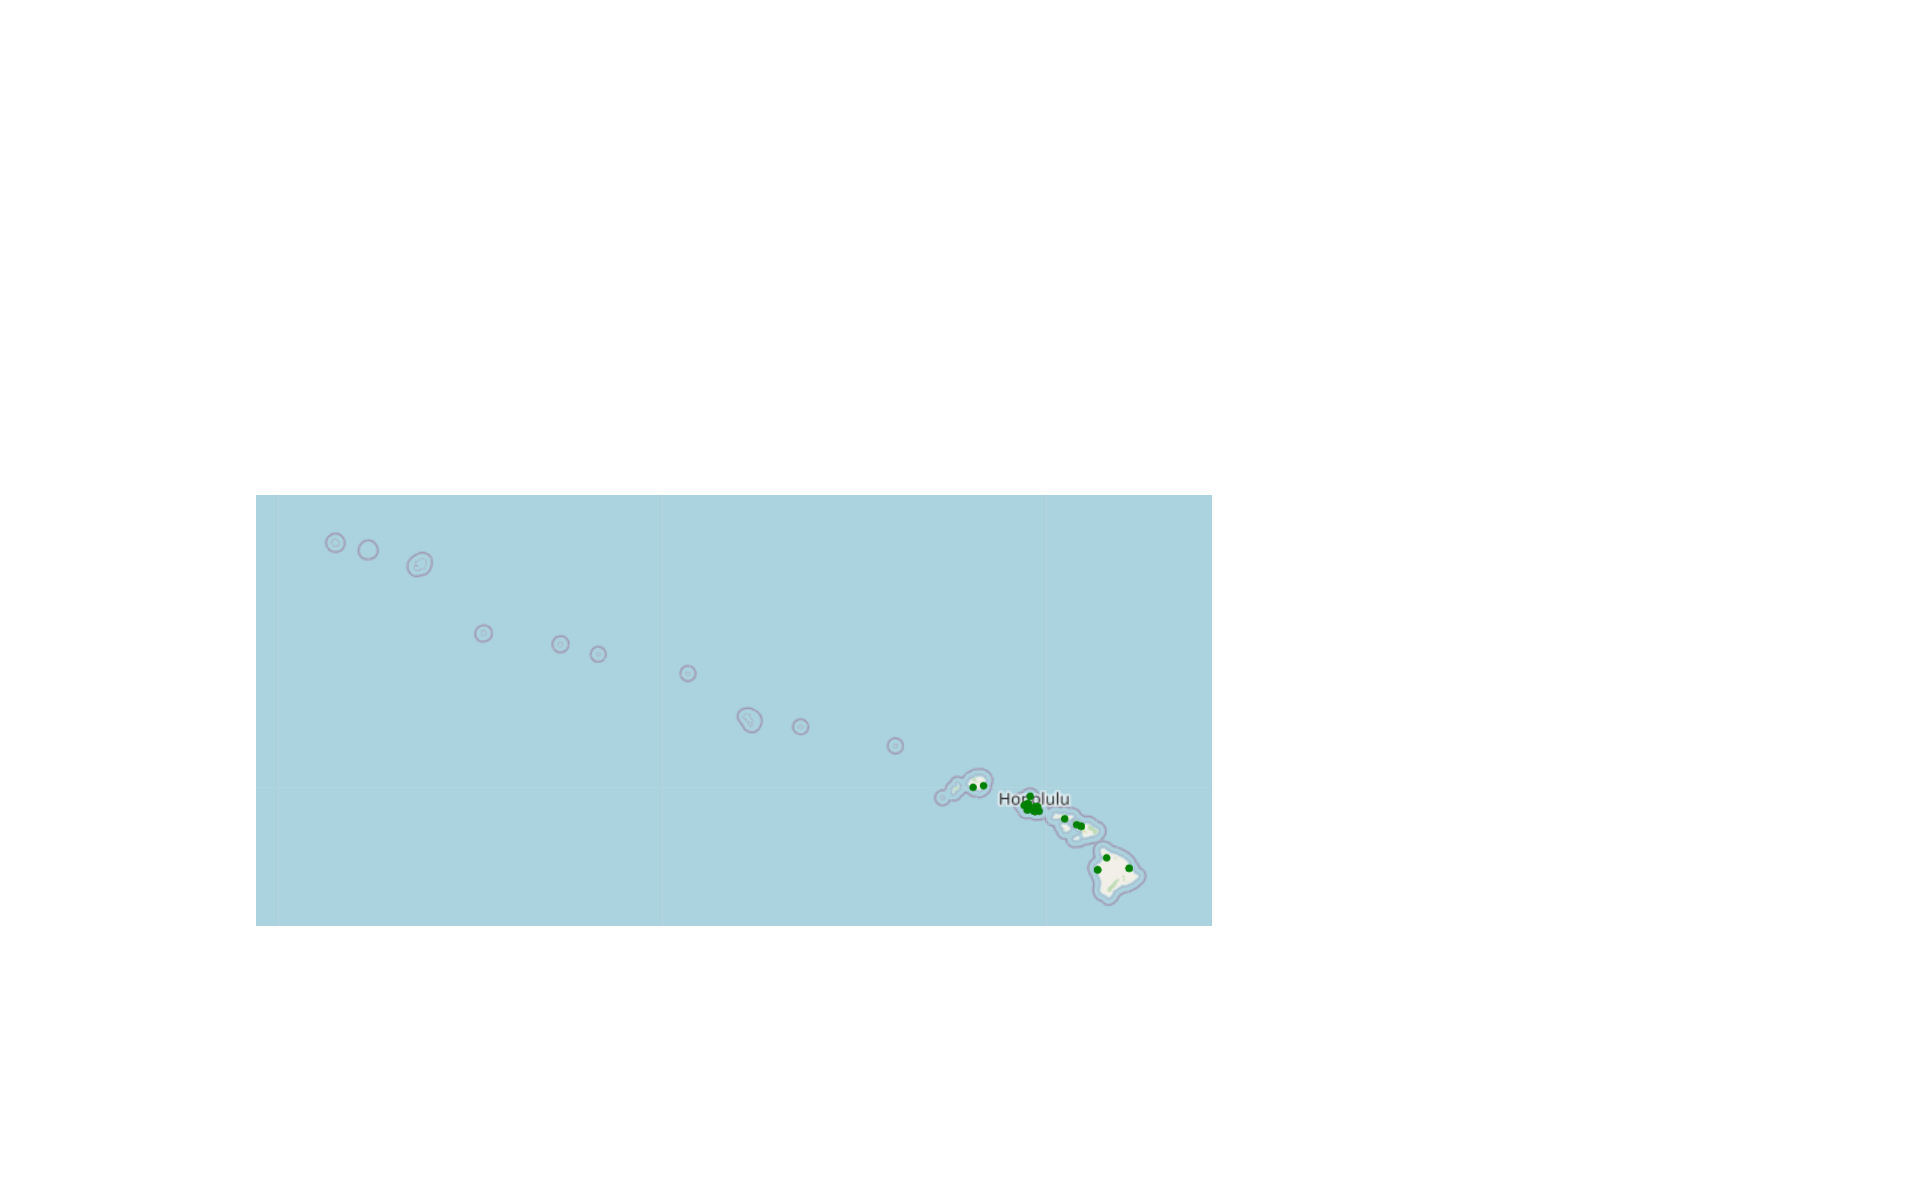
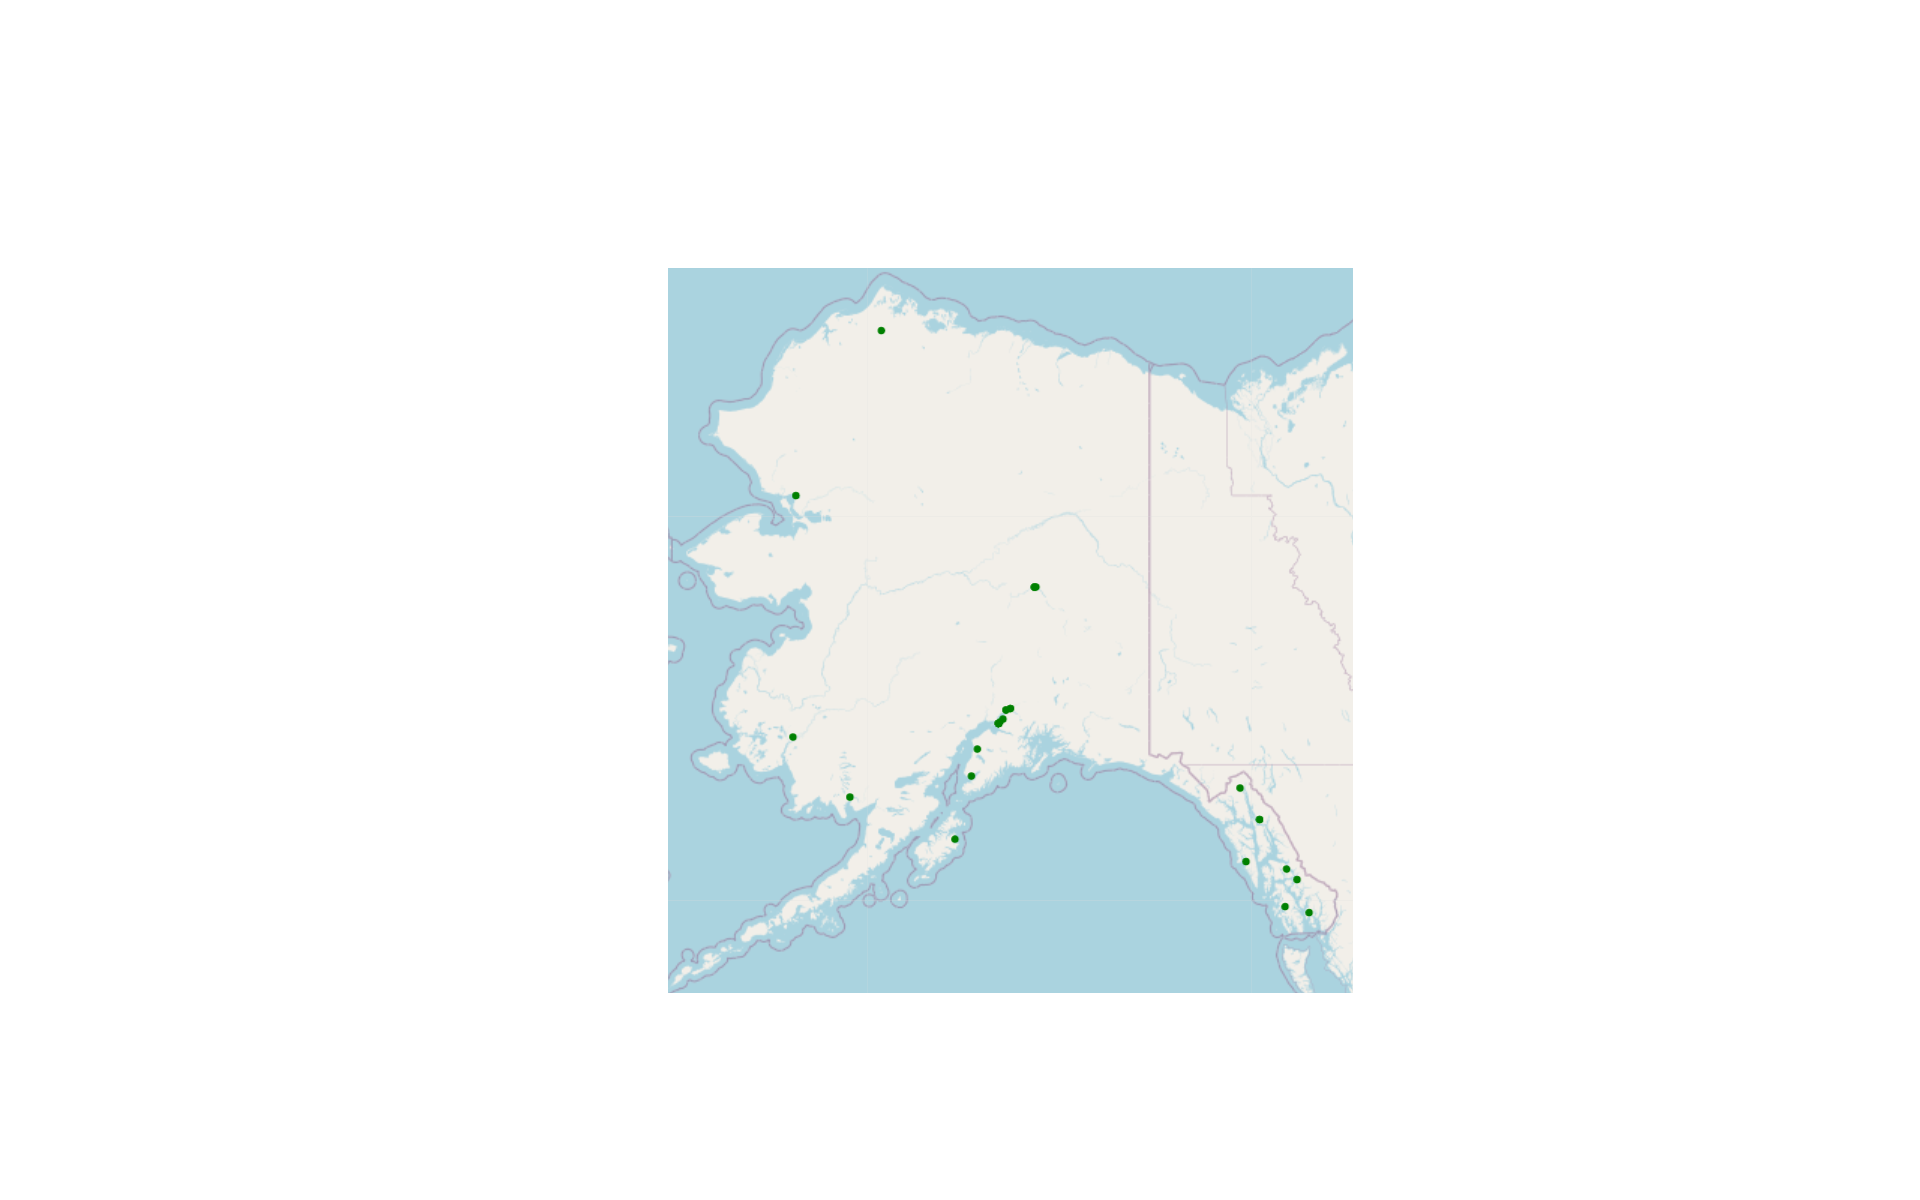
Datasets and Demographics: During our planning stage, we knew we wanted to include an extra dataset, but didn’t know which one would efficiently show a lack of coverage. We researched contributing factors to breast cancer and wanted to include race/ethnicity or socioeconomic status. However, we ran into roadblocks such as the most recent data being from 2010 and data not being quantified by state. This led to not being able to include as many datasets as we wanted, but the data we have now is more than sufficient to appropriately answer the prompt. Cleaning: Rows of data were shifted to the right between 1-4 cells, putting data in the wrong columns and leaving behind missing values on certain columns (ex: city and state columns were most commonly found to be empty). So, we had to iterate through each row and check which columns were missing information, and shift it accordingly Maps: One particularly hard problem that we faced was the creation of maps to visualize our data. Though creating the data that the maps was based off of was relatively simple, we struggled with finding useful libraries that would allow us to get a clear map. Once we found these libraries, we had to spend a lot of time reading documentation and researching ways to save the maps in the formats we wanted them in. Additionally, some of the maps (specifically the map of facilities in the US) took much longer to process (~50 minutes per attempt) due to the amount of points that were plotted as well as the time of the necessary computations. This led to us having to switch from using our laptops to a desktop computer in order to generate the map because our laptops were not able to finish generating it before it crashed.
Accomplishments that we're proud of
A few of us did not have experience whatsoever using pandas or cleaning data. However, with dedication and research we were able to create really impressive data visualizations that none of us had any experience with. On top of this, we endured through long hours of debugging but pulled through because of how badly we wanted our project to succeed.
What we learned
How to clean data and create bar graphs, dot maps, choropleth, linear regressions, debug pandas, find useful datasets, and create weighted models to answer real world problems.
What's next for Visualizing Gaps in U.S. Mammography Coverage
We wanted to include datasets that could give us a more nuanced understanding and interpretation of mammography coverage. This includes race and ethnicity (potentially more focused by county), We found a great dataset that included population demographics for the state of Texas, but due to time constraints we were unable to incorporate it into our analysis.

Log in or sign up for Devpost to join the conversation.