-
-
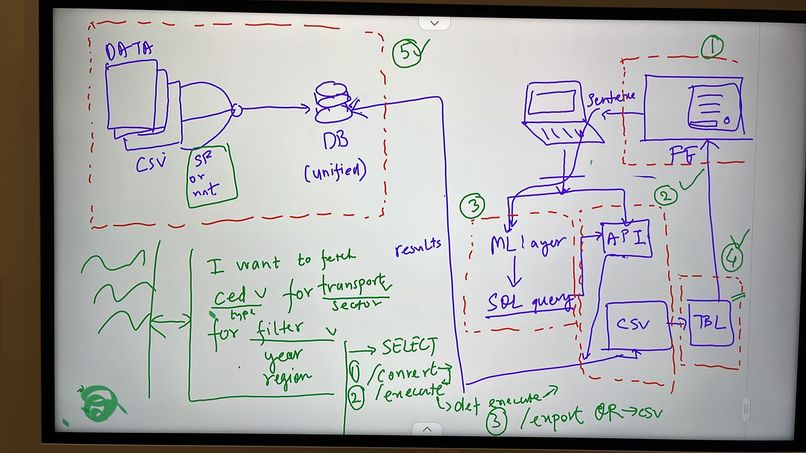
Architecture diagram
-
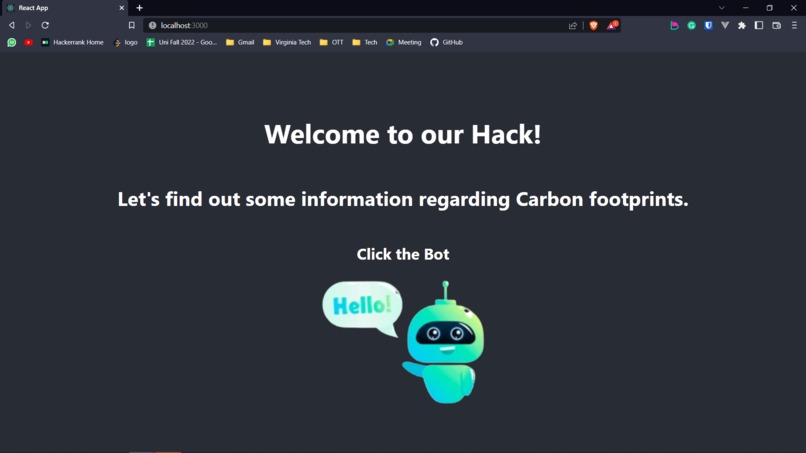
Home page
-
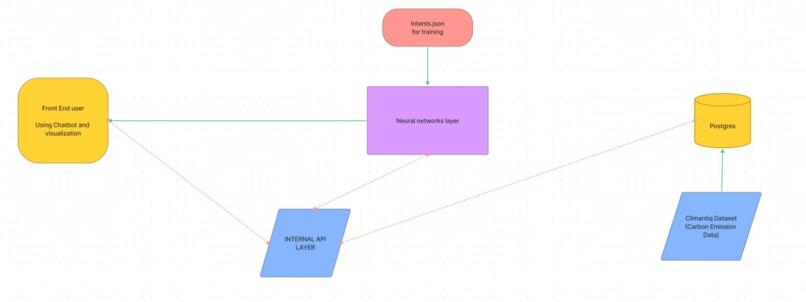
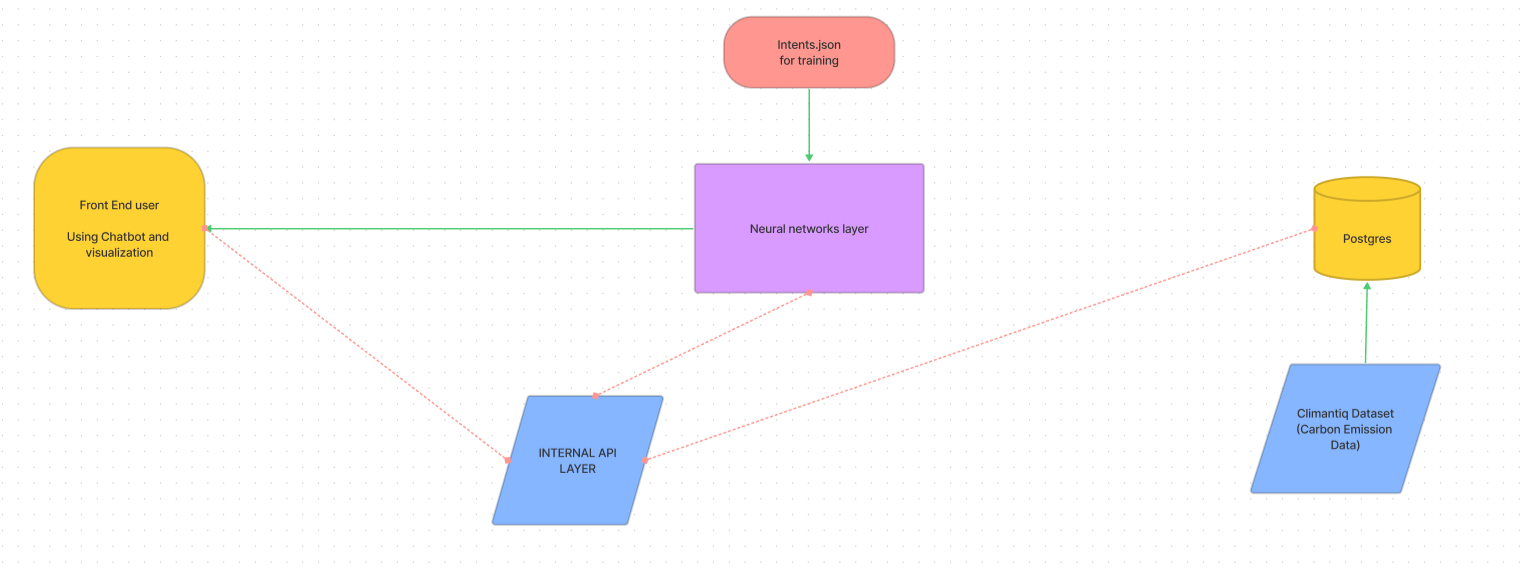
High level design


Inspiration
Sustainable future. We need to act on Climate change right now, to make our future generations' life better and sustainable. But we don't need to visualize the data sadly. Let's understand in a fun and intuitive way!
What it does
An end-to-end interactive and fun chatbot which can help visualize emission data.
How we built it
We used various technologies like postgressql, AWS, JavaScript, Flask, NLTK, Tensorflow, git, Html/css data visualization using plotly.js , etc. to achieve our goal of building an interactive chat bot .
Challenges we ran into
Data collection and creation , Minimum hands-on experience with Natural Language Processing Selecting a visualization tool for real-time data Many services that we wanted to use behind a paywall
Accomplishments that we're proud of
Implementing an end-to-end application within ~36 hrs Using a plethora of tools and technologies Excellent team building activity Networking Testing yourself in a competitive and a challenging environment Ease of Use
What we learned
Many innovative designs and ideas in a competitive scenario Design and critical thinking Increased hands-on experience with popular technologies and tools
What's next for SusBot
Increase interactivity with text-to-speech conversion and vice versa. Use much detailed visualizations Explore many more deep learning models to improve accuracy and efficiency. Improve UI.

Log in or sign up for Devpost to join the conversation.