-
-
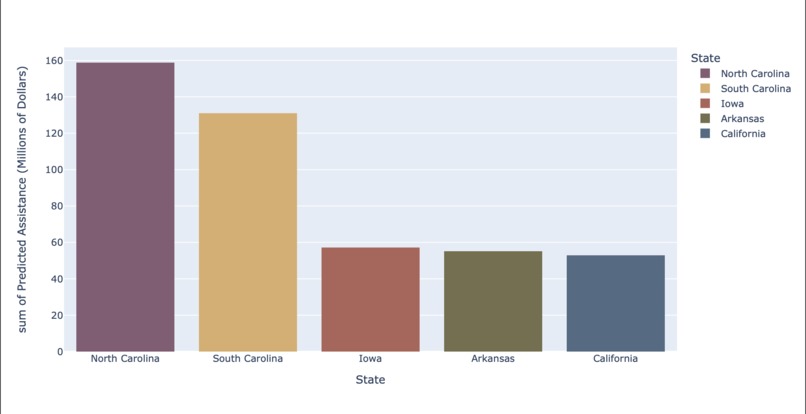
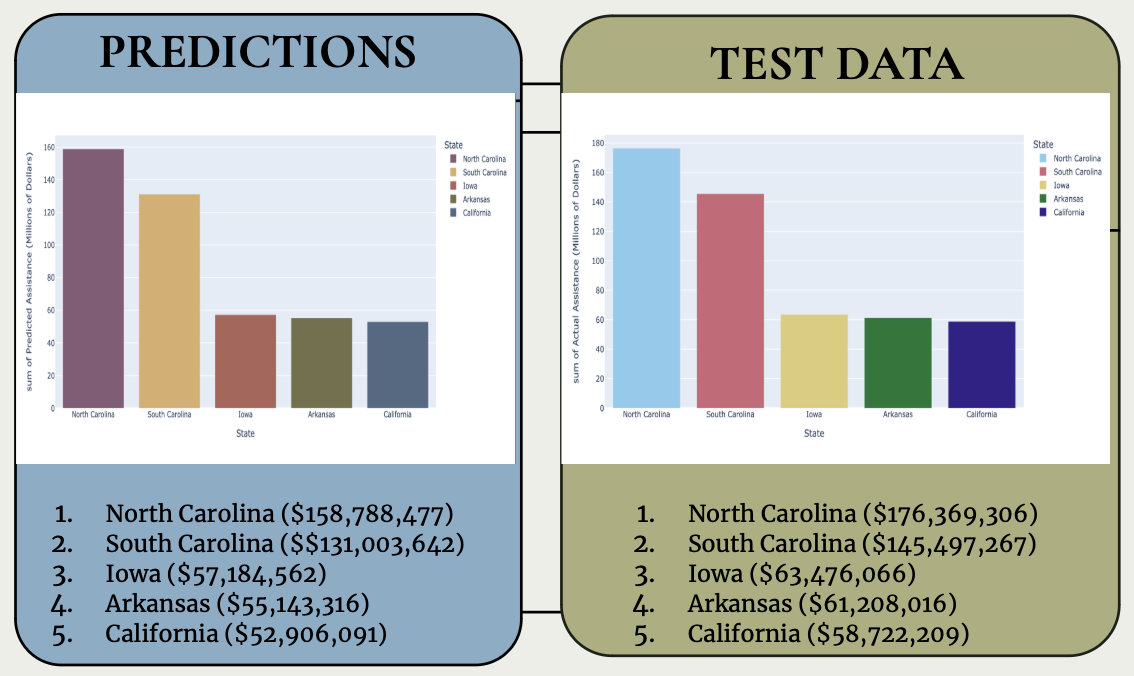
Top 5 states
-
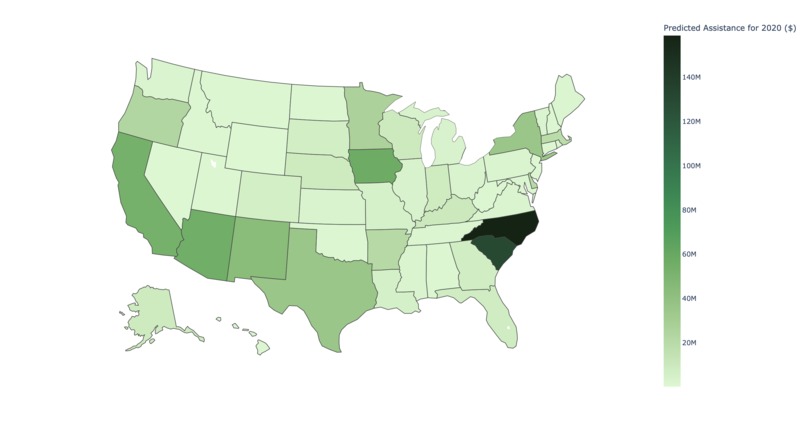
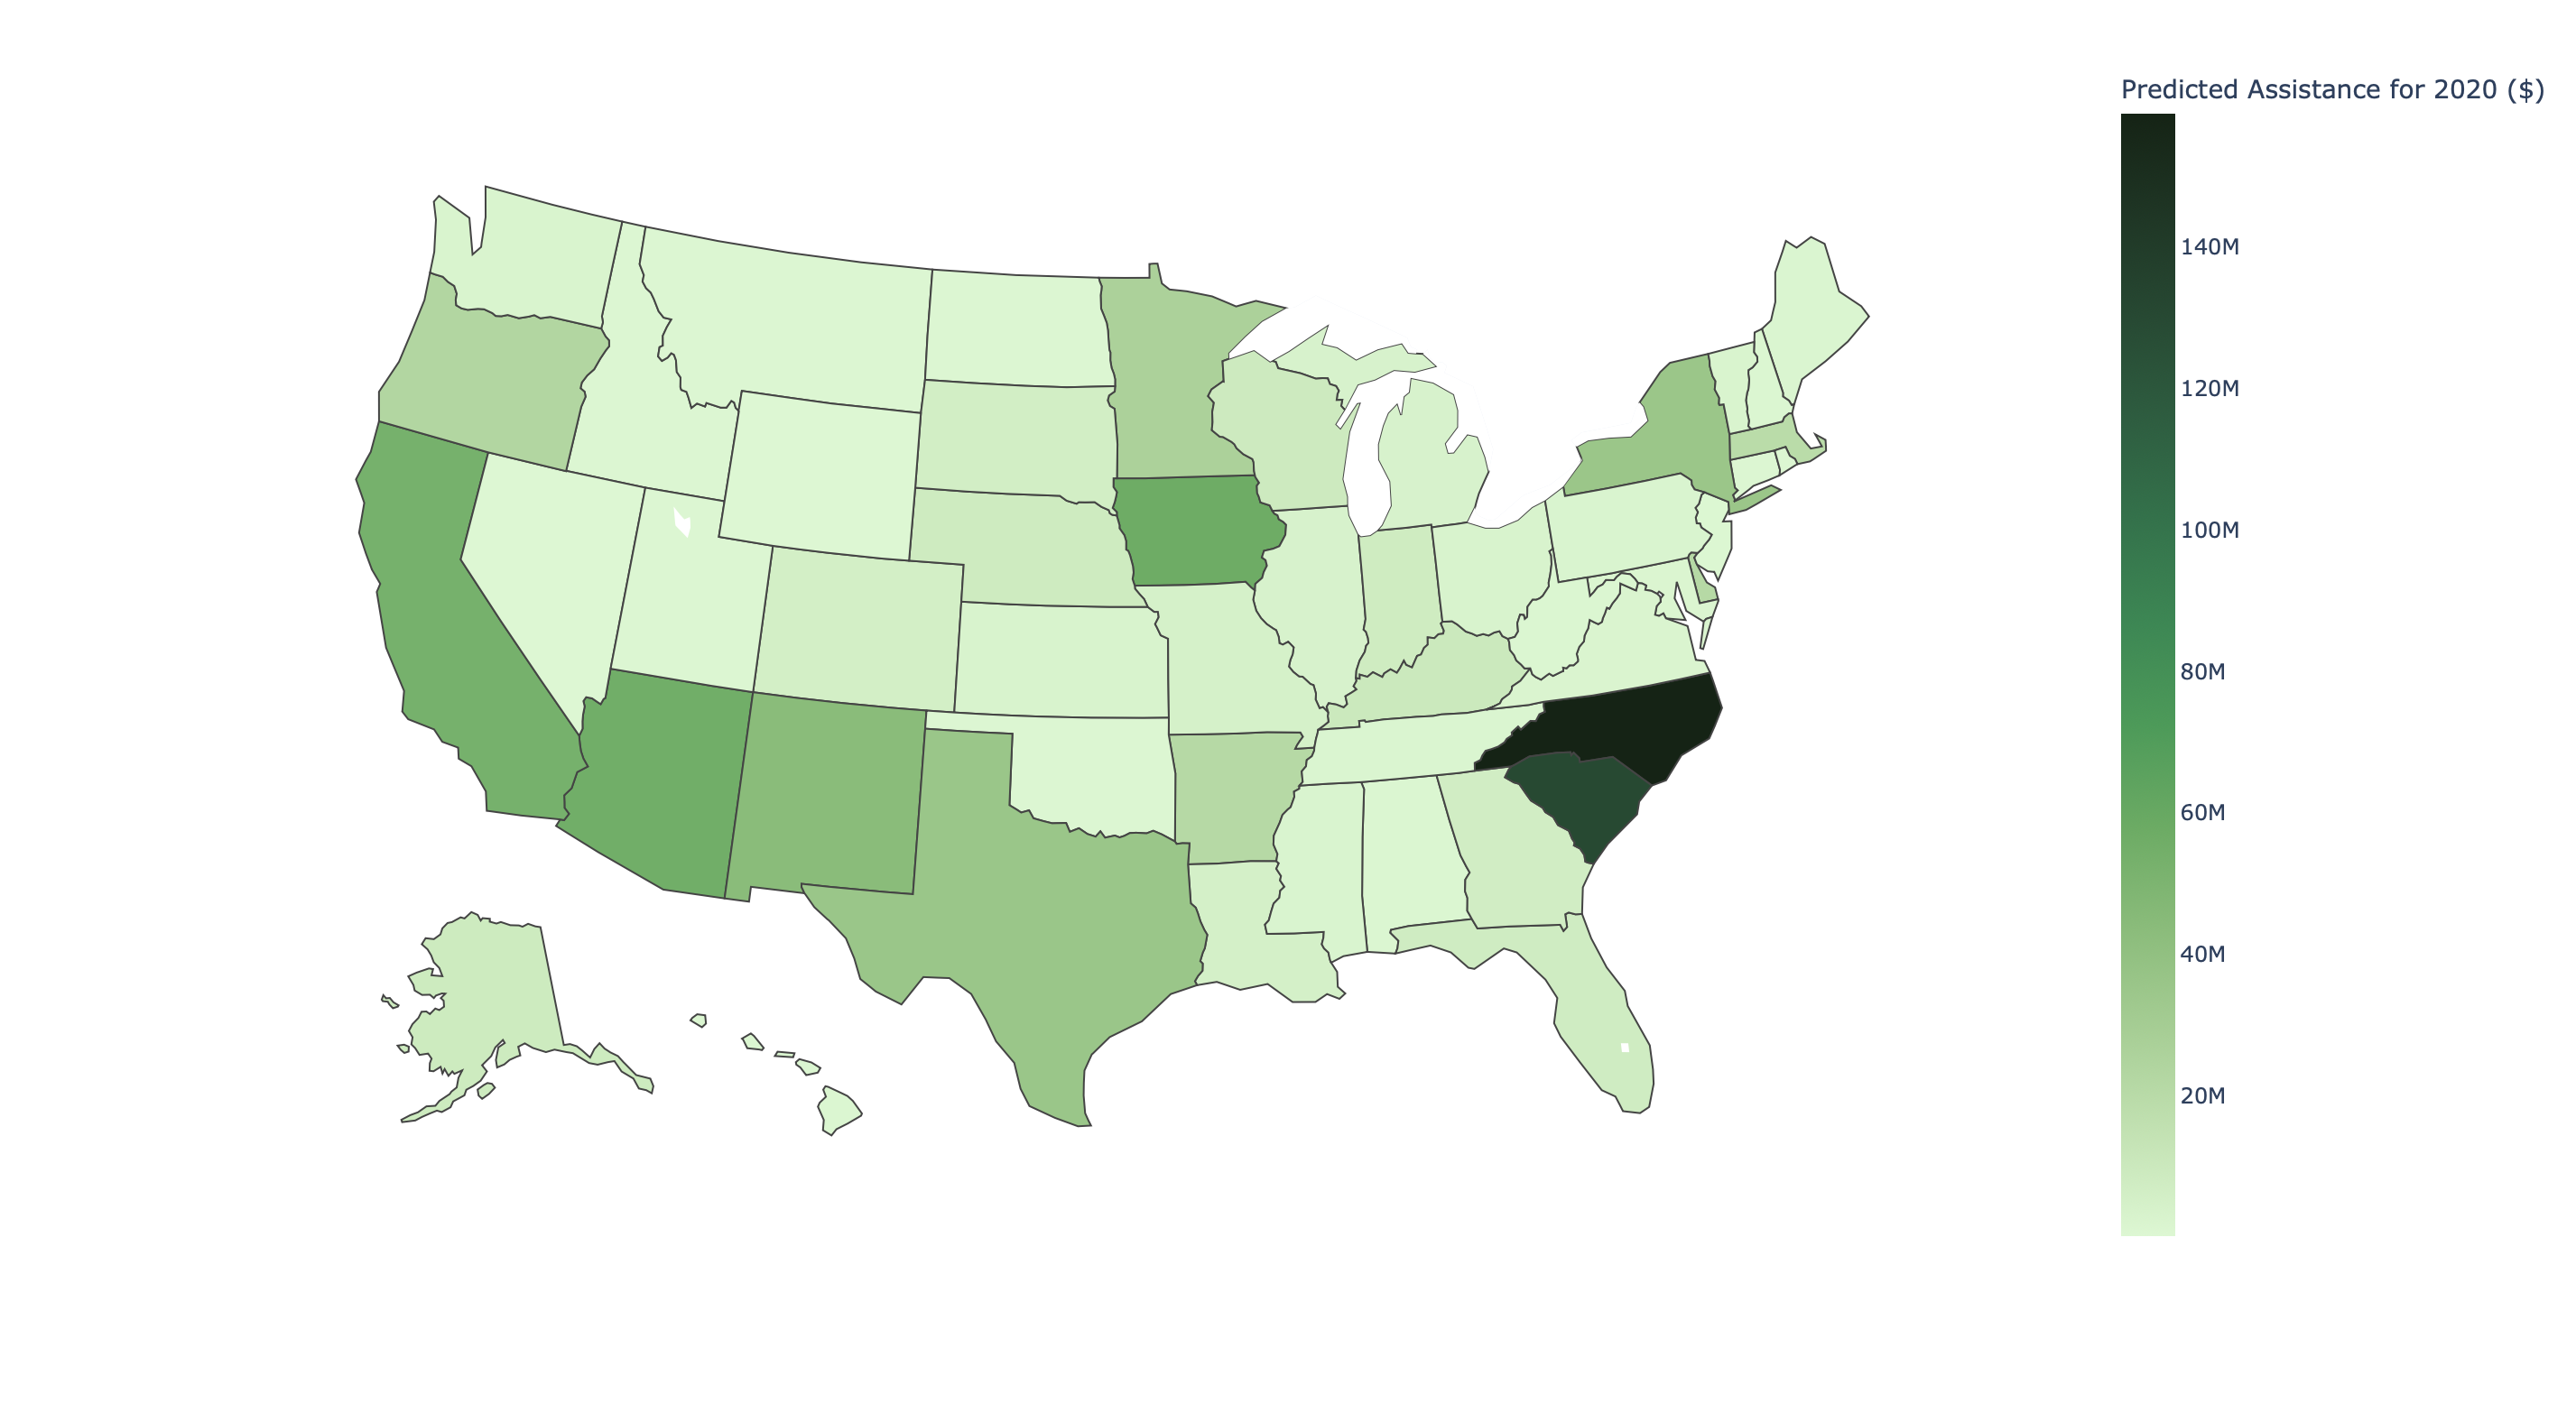
Amount of investment per state

Inspiration
At a time when employing sustainable practices is increasingly topical, renewable energy is growing rapidly, and Chevron presented a relevant problem — when high-profile companies invest in renewable energy, who are the best partners? How do we narrow down the most optimal collaborators when so many parties have joined the renewable energy movement?
Initial Steps
We first processed the data by removing null values and omitting DC and federal offshores since we wanted to focus on the 50 states (and the non-states had inconclusive data). We then visualized the monetary trends of each state by year, which made us realize that a simple linear regression or time series model would not be sufficient, since the year range is too limited, which leads us to the model we ended up using.
Data Visualization
Amount of assistance from 2015 - 2019
Results
submission file
Amount of assistance per state in 2020

Top 5 states receiving amount of assistance in 2020
How we built it
We decided to perform a grid search for a random forest, using the GridSearchCV function from scikit-learn library. This grid search tried different combinations of n_estimators and max_depth, and used 5-fold cross-validation to evaluate the performance of the model. I then used RandomForestRegressor to fit the training data and make predictions on test data. We originally decided against using time series because data per state does not exhibit a clear trend. However, there is a trend in the overall dataset and since the training dataset isn’t particularly large, we decided to use time series forecast as part of our final ensemble model. That being said, the majority of the production is contributed by a RandomForestRegressor.
In the final model, I group the DataFrame by state. For the time series, I fit an ARIMA model using the data from the past 5 years, then use the fitted model to predict investment in 2020. Using the best parameters found through grid search, I fit the best RandomForestRegressor model to the entire training data and then predicted the amount of investment for 2020. By processing the feature vectors the same way I processed the training data set. For the ensemble part of my model, through trial and error during training, I found a good ratio for how much weight is given to time series prediction and RandomForestRegressor, which I applied to testing.
Challenges we ran into
If we had time, we would try to find datasets to augment the training data, such as data from years before 2015 and/or other data sets that can provide additional feature vectors. I would also use a decision tree to figure out the weight for a ARIMA and random forest instead of using trial and error.
Accomplishments that we're proud of
Our data correctly predicted the top five states with the greatest amount of assistance that were the same as those in the testing dataset for 2020. We also employed a complex model that generated relatively accurate predictions (in terms of the order in which states had investments in 2020 at least) within a limited time span.
What's next for "Fueling" Clean Initiatives
We would love to look into additional datasets and factor in additional variables to help make a more informed decision about choosing investors. Exploring the alternative fuel data more in-depth, for example, would help us identify an economic incentive in investing in states that encourage use of renewable energy. In addition, looking at data within what we were provided such as CO2 emissions, or mapping amount produced to amount invested to identify productivity trends, would make our models more holistic and mitigate the problem this challenge presented better.
Built With
- matplotlib
- pandas
- plotly
- scikit-learn
- statsmodels

Log in or sign up for Devpost to join the conversation.