Inspiration
The idea for the Personal Weather Station Dashboard was born from our desire to monitor hyperlocal weather conditions using publicly available data. We wanted to create a simple yet effective dashboard to help individuals and communities visualize and track weather changes in real time using open APIs.
What it does
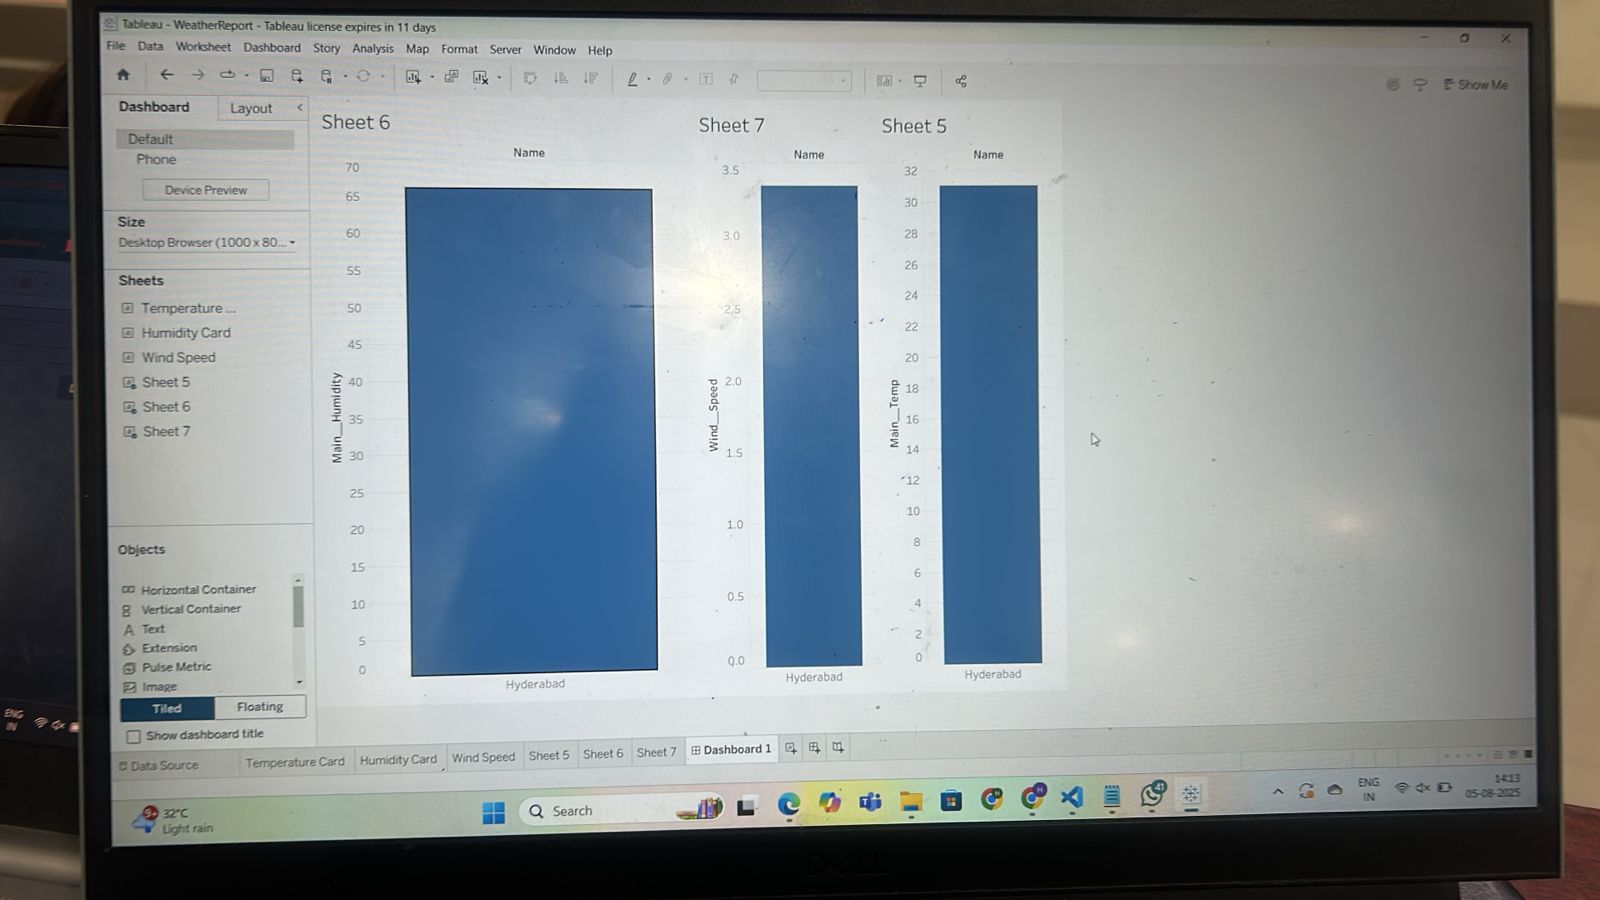
The dashboard collects weather data such as:
- Temperature ((^\circ C))
- Humidity ((%))
- Air pressure ((hPa))
It fetches this data from reliable weather APIs and presents it in a clean, interactive interface. Users can view real-time updates and explore visualizations to track trends over time.
How we built it
We combined data engineering, analytics, and visual design to bring this project to life.
The dashboard polls data from the API at regular intervals and updates the charts in real time.
Challenges we ran into
- Managing API limits and ensuring data consistency
- Building responsive and interactive charts
- Handling edge cases like missing or delayed API responses
- Designing a minimal yet effective UI
Accomplishments that we're proud of
- Created a fully functional real-time weather dashboard
- Seamless integration of third-party APIs
- Clean, intuitive data visualizations
- Learned end-to-end deployment of a full-stack app
What we learned
- Working with REST APIs and data parsing
- Dynamic charting and frontend interactivity
- Backend API scheduling and error handling
- Deployment and version control best practices
What's next for Personal Weather Station Dashboard
- Add historical comparisons and weather alerts
- Support for multiple cities and user preferences
- Push notifications or email weather summaries
- Mobile app version for broader accessibility

Log in or sign up for Devpost to join the conversation.