Inspiration
I love music, so it'd make sense to take a look at Spotify's streaming trends for the Day 3 data visualization challenge.
What it does
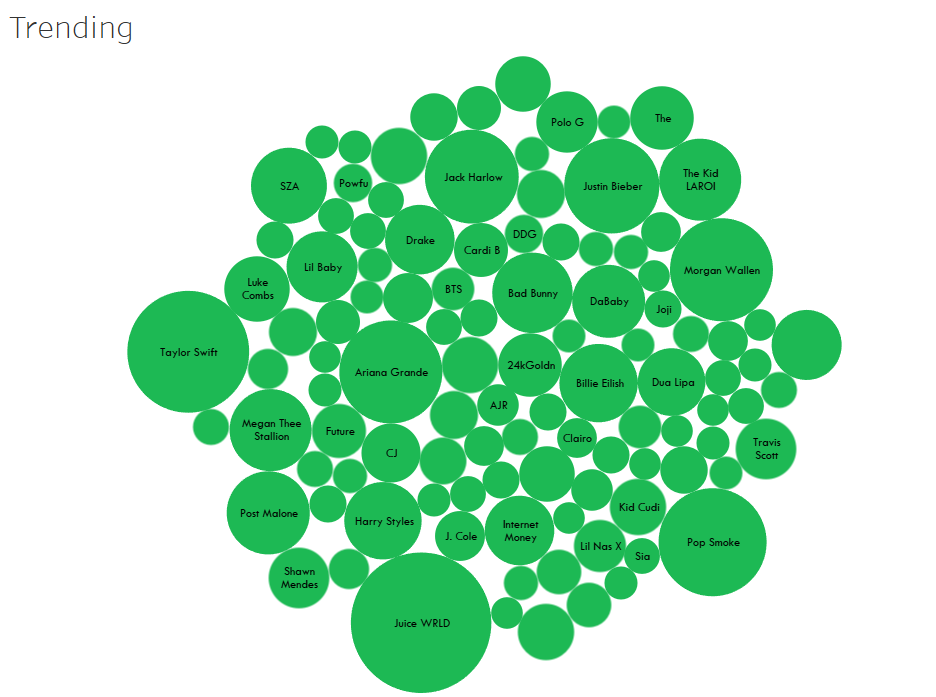
This packed bubbles graph shows which artists on the Spotify US Top 200 list had the most streams for the week of January 7th. The bigger the bubble, the more their songs were streamed. Right now, it looks like Juice WRLD is in the lead, but who knows if the Spotify listeners tomorrow will turn the tide?
How we built it
I used Spotify charts to filter and obtain the data I needed before importing it as a text file into Tableau. Since this was my first time using Tableau, I fiddled around with just two variables: the artist name and the total number of streams their songs received this week. The end result is this graph.
What we learned
Now, I know how to import data into, create visuals with, and customize the resulting graphs with Tableau's desktop app.


Log in or sign up for Devpost to join the conversation.