-
Data Visualization Graph
Inspiration
Inspired by my finance background as a member of SWS at UVA, I learned how useful it is to visualize data to be successful at the time of investing in a company.
How we built it
Tableau Software
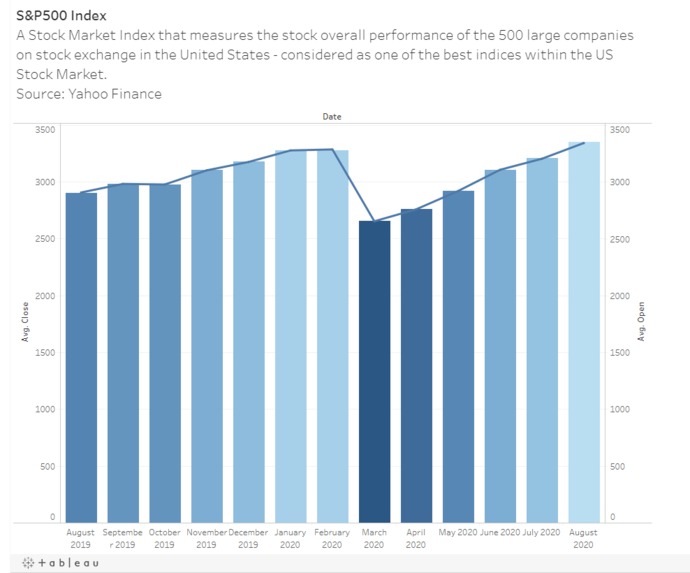
Graph that presents the Stock Market Index S&P 500 that measures the stock performance of the 500 large companies on the stock exchange in the US.

Data Visualization Graph
Inspired by my finance background as a member of SWS at UVA, I learned how useful it is to visualize data to be successful at the time of investing in a company.
Tableau Software

Leave feedback in the comments!