Devpost
Participate in our public hackathons
Devpost for Teams
Access your company's private hackathons
Grow your developer ecosystem and promote your platform
Drive innovation, collaboration, and retention within your organization
By use case
Blog
Insights into hackathon planning and participation
Customer stories
Inspiration from peers and other industry leaders
Planning guides
Best practices for planning online and in-person hackathons
Webinars & events
Upcoming events and on-demand recordings
Help desk
Common questions and support documentation
Sort by:
FIGHT AGAINST MALNUTRITION
We help international students make better decisions in pursuit of successful careers in Australia. We do this by providing examples from the successful international student community backed by AI.
A one-stop portal for the Chesapeake Bay community
The data set was cleaned using jupyterlab and then fed into tableau for analysis
Find opportunities for City-Corporations collaboration on sustainability goals
How does a tributary of the South River compare with the Chesapeake Bay?
The state and federal governments have input large efforts in Chesapeake Bay restoration since 2019. I am starting this project with the hope to see has those efforts paid off?
A safety website for the Atlanta area that provides data on crimes based on location. Our goal is to help people make informed decisions while traveling.
To empower elderly patients to access quality care at the lowest costs
A Covid-19 data visualization for all to see.
An interactive visualization tool to help better understand the trends and future projection of wildfires
Digital Health Solutions for Connected Health and COVID-19 Pandemic
test
How student performance differs from online and inperson section of a same course
visualize loss of learning for different communities
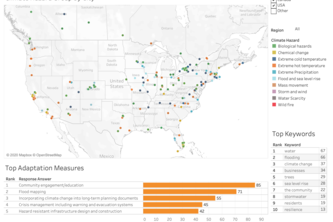
Analysis of Climate Risk & Adaptation Measures in North America
Our solution draws on CDP data, intuitive visualizations and AI analysis to discover potential for city-business collaboration to accelerate bioregional regeneration.
INCODA is a web application to help Hoosiers assess risk while planning daily activities using a 7 day outbreak forecast, and get alerts of potential risks using email notifications.
Avoid risky areas with our sub-county level outbreak detection heat map.
Interactive Key Performance Indicator (KPI) Visualization
gauge how happy t
Analyzing and Visualizing the World Happiness Index Dataset
Help the people affected by COVID 19 in finding jobs
A COVID-19 dashboard that has current information on the current crisis.