Devpost
Participate in our public hackathons
Devpost for Teams
Access your company's private hackathons
Grow your developer ecosystem and promote your platform
Drive innovation, collaboration, and retention within your organization
By use case
Blog
Insights into hackathon planning and participation
Customer stories
Inspiration from peers and other industry leaders
Planning guides
Best practices for planning online and in-person hackathons
Webinars & events
Upcoming events and on-demand recordings
Help desk
Common questions and support documentation
Sort by:
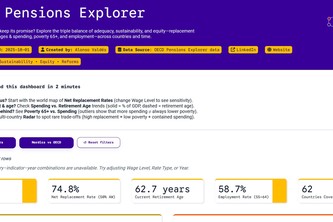
Will your pension keep its promise? Explore the triple balance of adequacy, sustainability, and equity replacement rates, retirement ages & spending, poverty 65+, and employment across countries.
An interactive COVID-19 dashboard built with Plotly, visualizing cases, deaths, and trends across countries with line, bar, and pie charts.
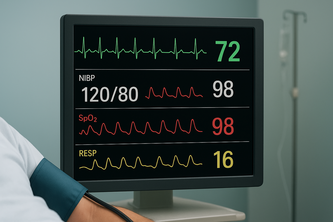
Real-time monitoring and analysis of critical patient vital signs including heart rate, oxygen levels, and temperature to support healthcare professionals in emergency and routine care situations .
Discover undervalued, overhyped, and leading tokens in real time with interactive visualizations powered by Plotly Dash.
Comprehensive analysis of YouTube channel performance metrics including revenue, engagement, viewership patterns, and content optimization insights across video publishing timeline.
A data app analyzing gender gaps in education, employment, health, and wellbeing across OECD countries to promote women’s empowerment through insights.
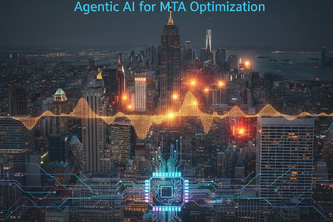
Optimizing accessibility investments by prioritizing stations with the highest ridership, failures, and community vulnerability.
Explore OECD wellbeing across countries, domains, and demographics and see who’s smiling!
Disaster planning is costly guesswork. We quantify climate project ROI using inflation-adjusted data to justifies critical investment. Calculate returns, not losses.
To address the needs of the MIMAT, we built an application empowering people to easily submit media of waste documentation and GPS data, rendered on a detailed map, providing actionable info to MIMAT.
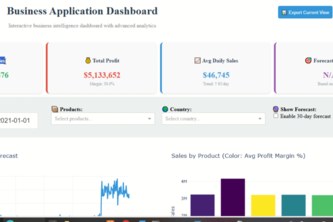
Monitor sales performance, analyze trends, and identify opportunities
How to protect you and your baby from heat and bad air!
Interactive exploration of OECD Better Life Index indicators to analyze quality of life metrics and well-being trends globally.
Explore wellbeing across the globe with interactive data insights.
Create synthetic data and demonstrate the power of Plotly Studio
predicts patient outcomes 📊, finds similar past cases 🧬, generates AI-driven recommendations 💡, and provides hospital-wide insights 📊 for smarter, faster healthcare decisions.
Verity: Where AI models unite for superior review classification.
Rewarding Quality, Not Just Virality: Smarter Creator Incentives Through AI
AI-powered system to forecast energy demand and detect anomalies in Indian buildings, enabling cost savings, stable grids, and carbon reduction.
Forecasting energy demands with accuracy to optimize resources, prevent shortages, and build a resilient energy future!
“Smart energy management system using AI for forecasting and anomaly detection, enabling cost savings, fault prevention, and greener buildings.”
BHOOMRA harnesses satellite data and AI to map India’s diverse crops with accuracy, empowering farmers, policymakers, and agri-businesses with real-time, field-level intelligence.