Inspiration
My inspiration came from a core frustration: the disconnect between the evident need for resilience and the inability of advocates to secure funding. I noticed that engineers and scientists spoke in terms of "lives saved" and "damages avoided," while treasurers and insurers spoke in terms of Net Present Value (NPV) and risk-adjusted returns.
The catalyst was realizing that ROI is the only metric universally respected across government, finance, and engineering. If we could frame a $10 million seawall not as a cost, but as an investment guaranteeing a 20% Disaster-Adjusted ROI (by preventing an expected $2 million in annual losses), the conversation instantly shifts from an expense to an asset. The challenge was developing a transparent, defensible methodology to calculate that number.
What it does
The Resilience Investment Dashboard is a tool that transforms disaster risk reduction (DRR) from a speculative cost into a quantified financial optimization opportunity. For too long, decisions about climate adaptation and resilience projects have been plagued by guesswork, political cycles, and a reliance on incomplete, non-standardized loss data. This leads to malinvestment or, worse, paralysis, leaving communities exposed to multi-billion dollar, avoidable losses.
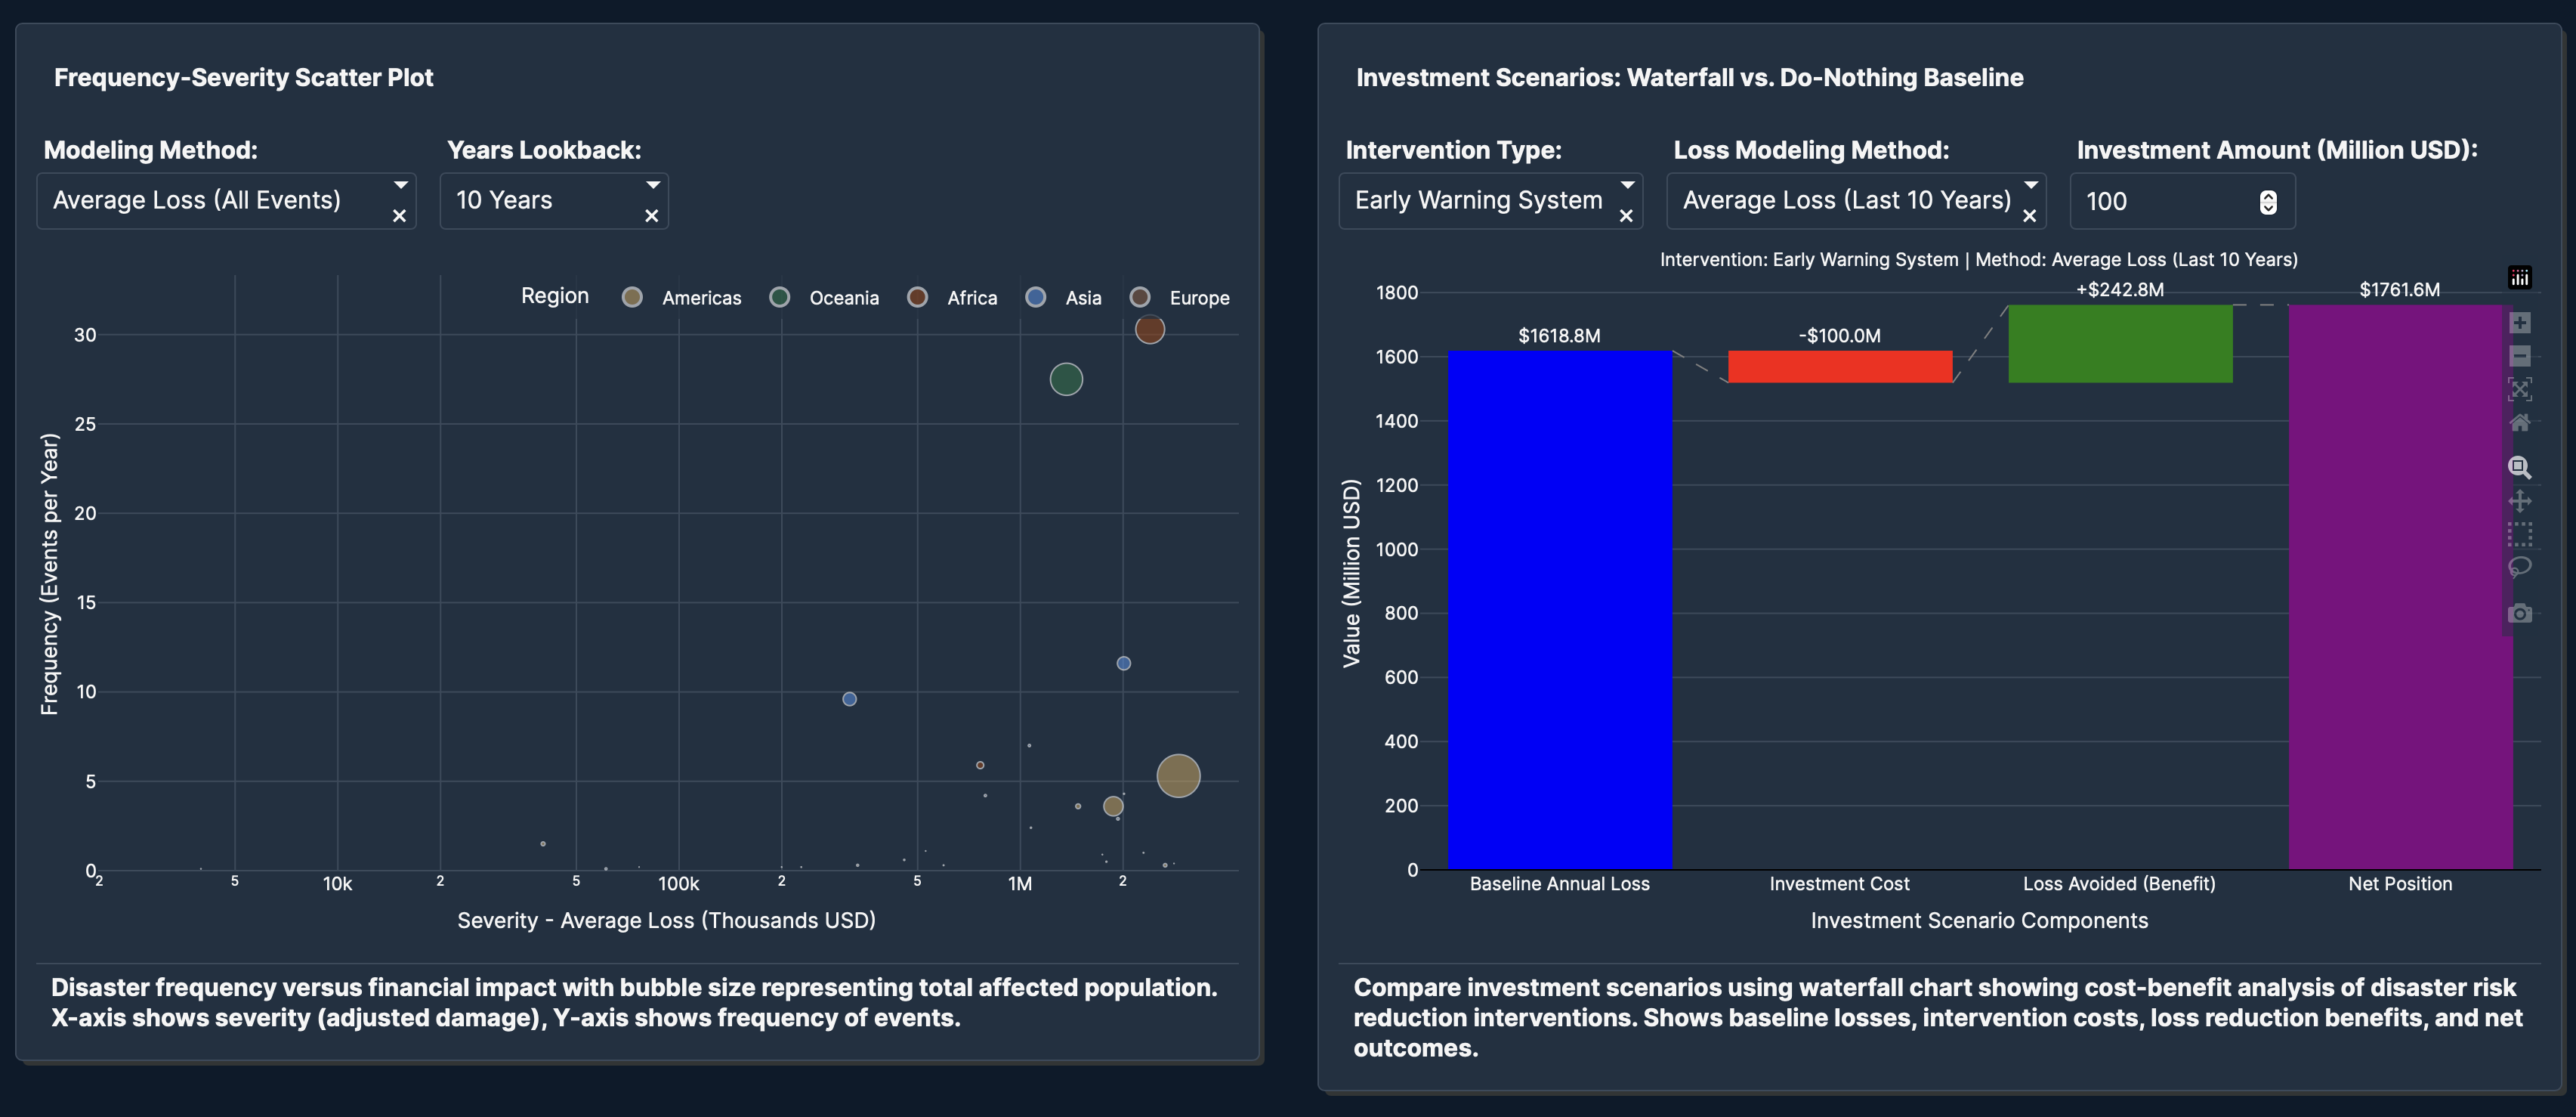
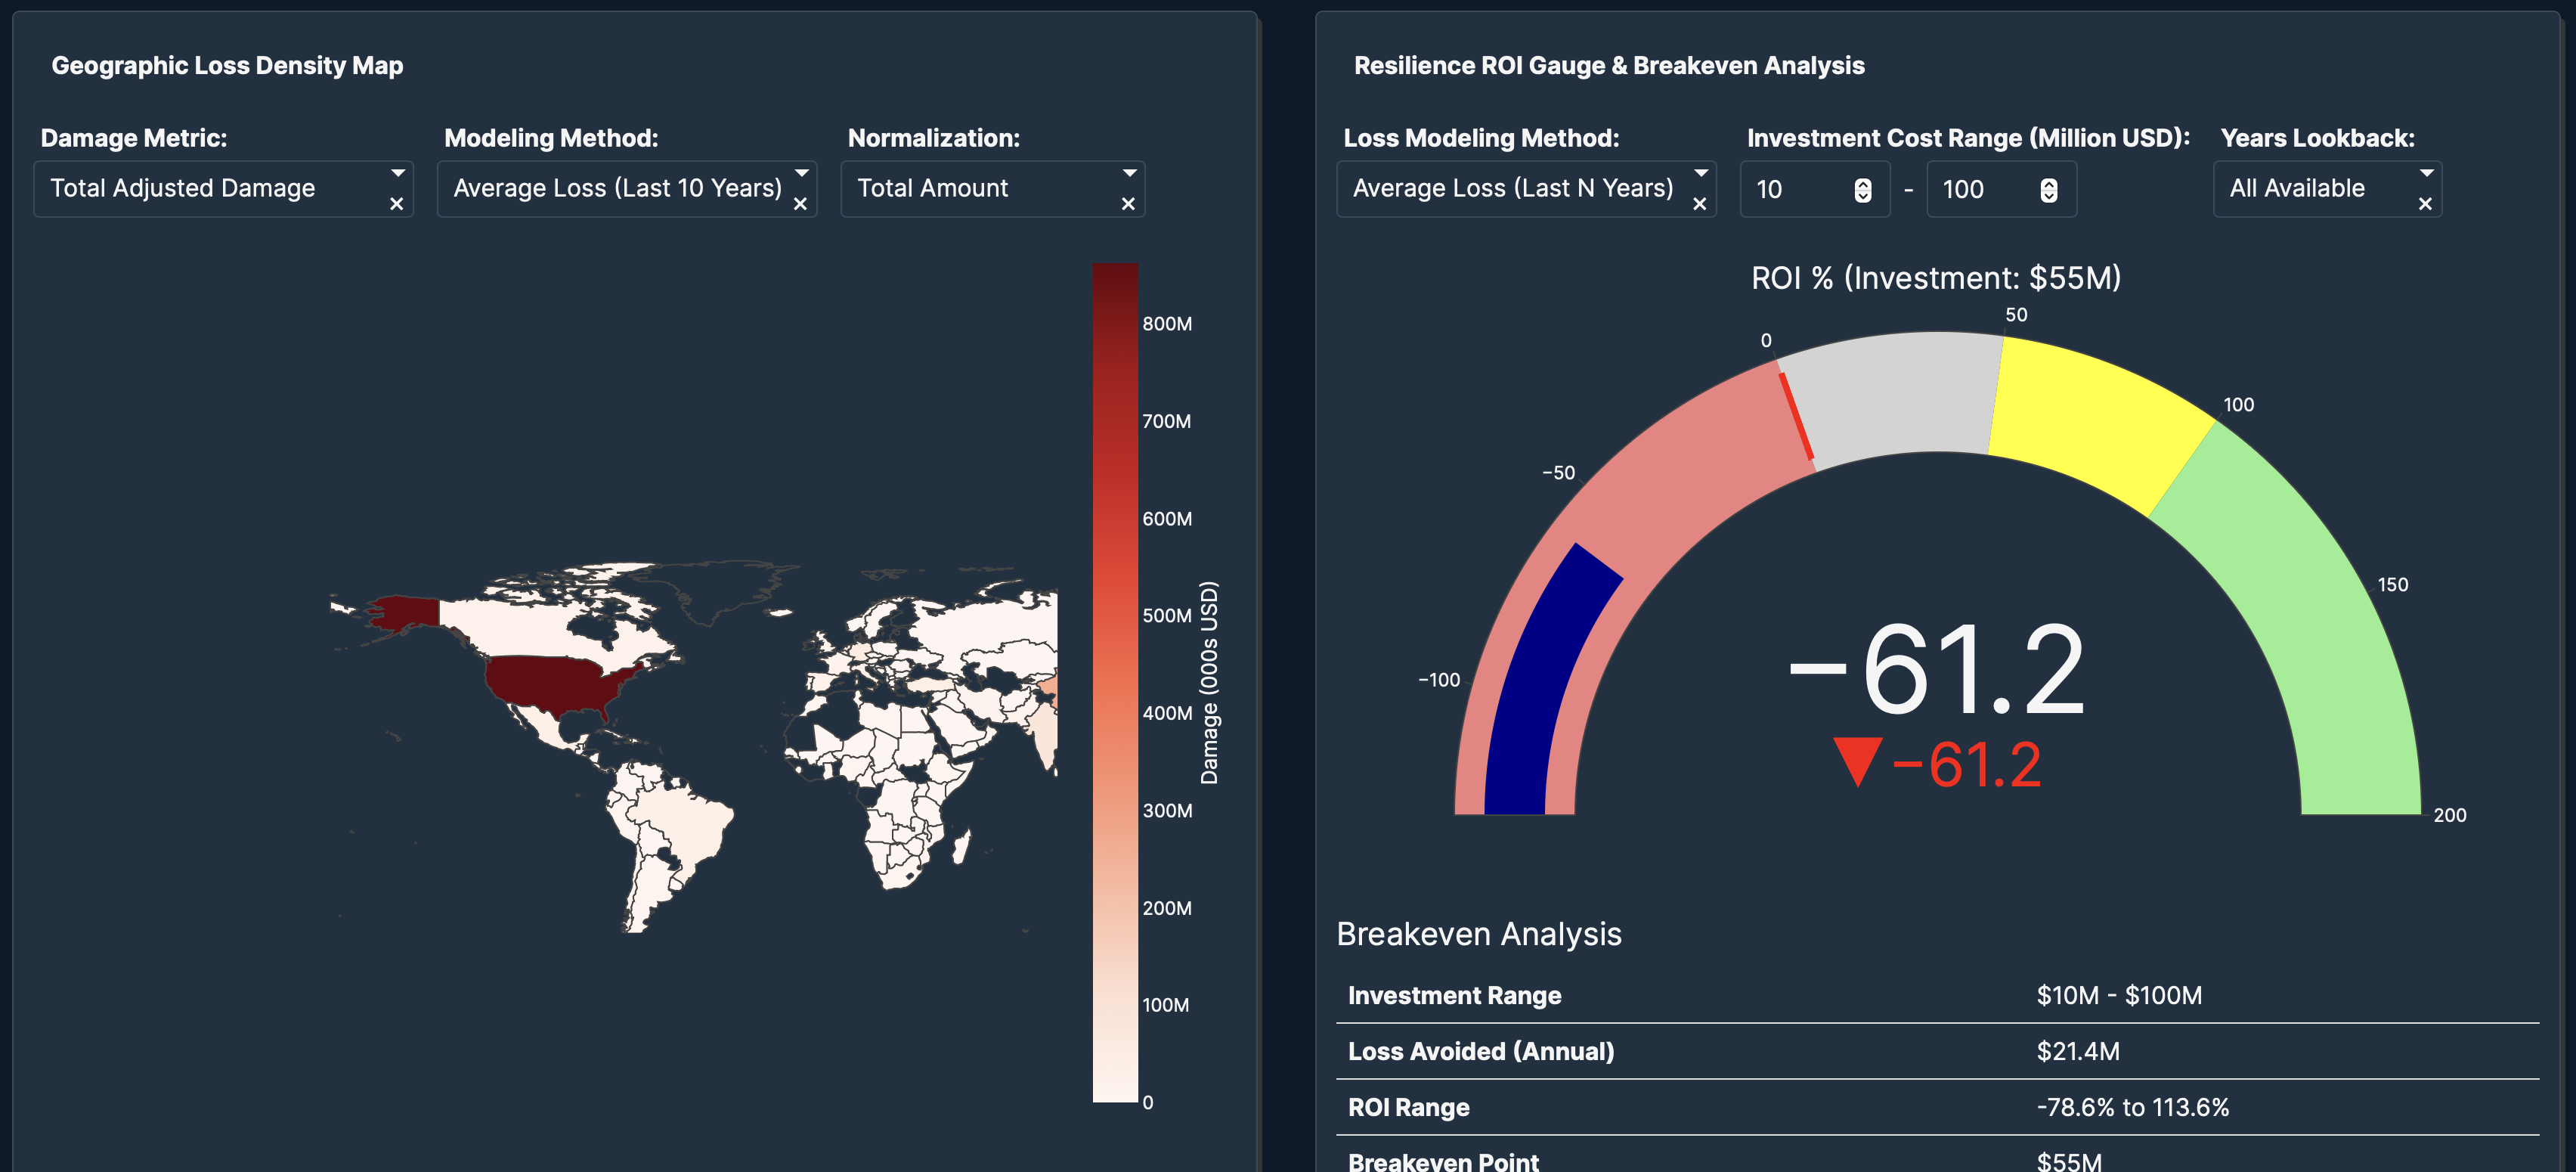
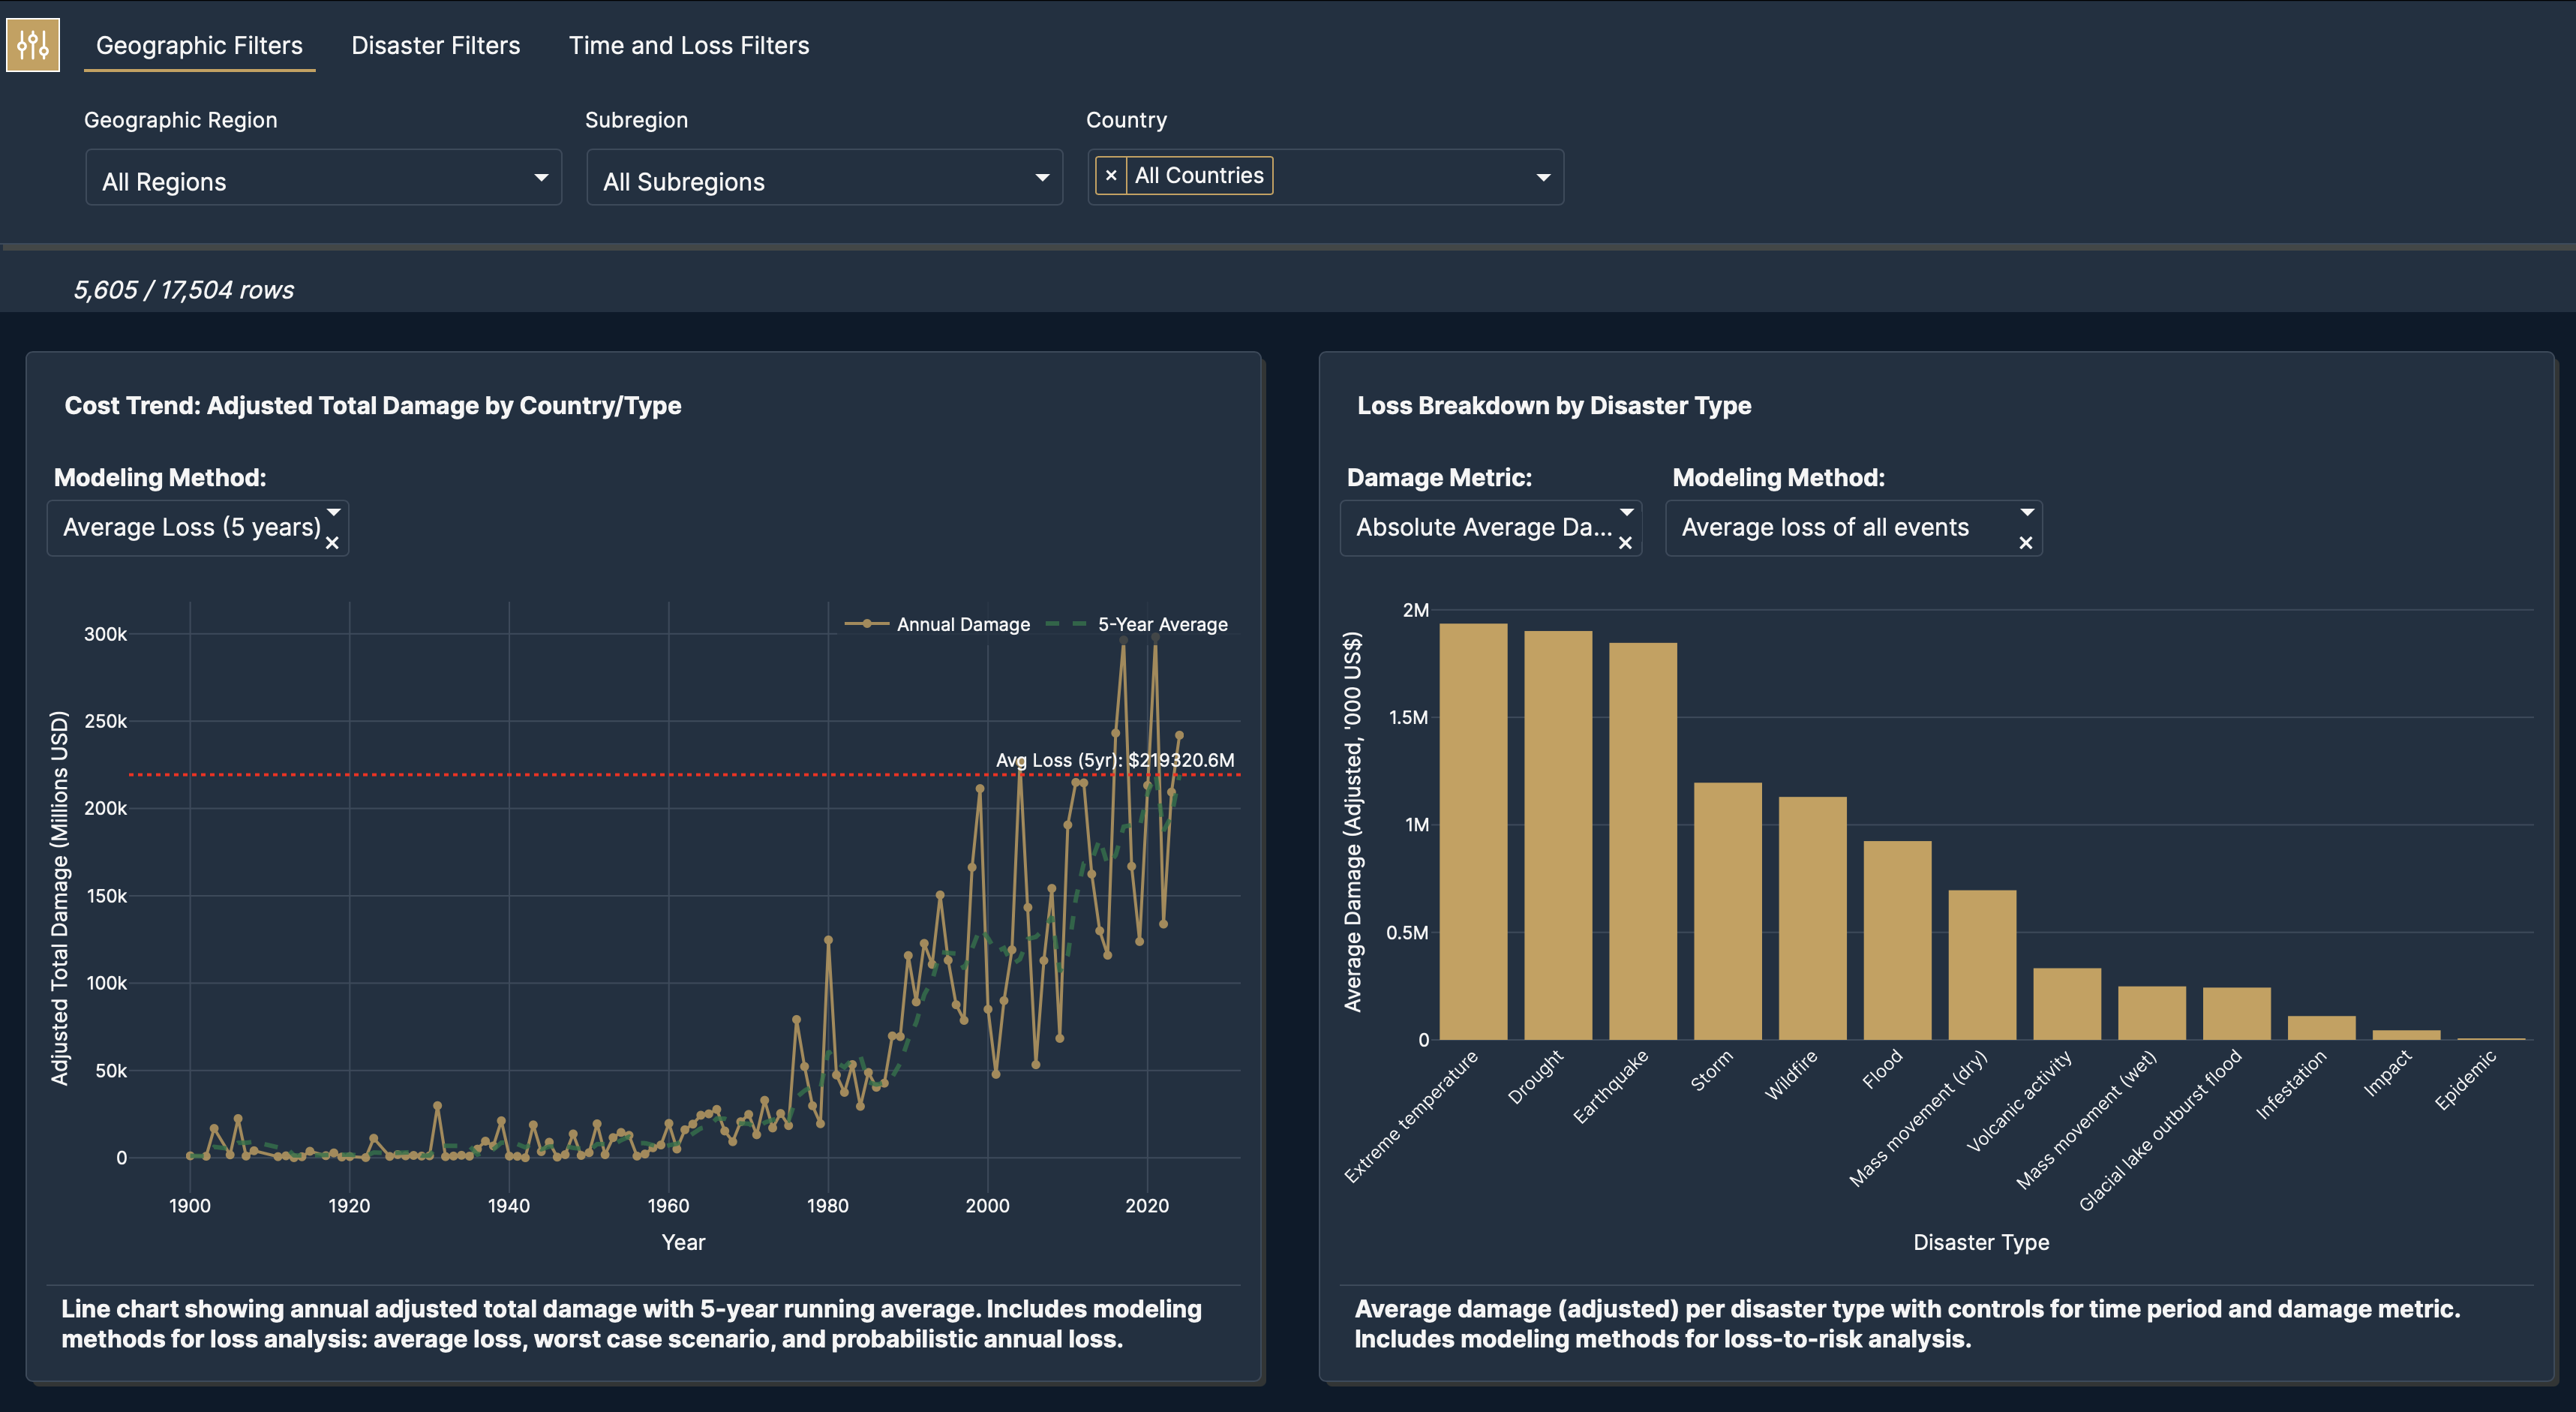
The Dashboard solves this by leveraging EM-DAT's historical, inflation-adjusted loss data to calculate a single, crucial metric: the Disaster-Adjusted Return on Investment for any proposed project. This metric acts as the "Universal Language of Capital," allowing an engineer's flood mitigation plan to be directly evaluated against a city treasurer's bond yield, enabling data-driven capital allocation for governments and insurers.
How we built it
Data Ingestion and Cleansing: I started by ingesting EM-DAT's historical disaster loss database. The key step here was implementing an inflation-adjustment model to normalize all historical losses to current-year dollars, ensuring financial comparability.
Risk Modeling Framework: I developed a simplified risk framework that correlates disaster frequency and severity (from EM-DAT) with the project’s target region/asset type. This enabled the calculation of Anticipated Annual Loss (AAL) for a baseline scenario.
Project Scenario Modeling: The user inputs the proposed project's Initial Cost (C0), Annual Maintenance (CM), and the project’s estimated Loss Reduction Percentage (η).
ROI_DR Calculation: The tool calculates the annual return as the prevented loss: Annual Return=(AAL×η)−CM. This is then used to compute the final Disaster-Adjusted ROI.
Dashboard Visualization: The final stage was creating an interactive dashboard (using Plotly and Dash) to visualize the ROI_DR against a standard hurdle rate (e.g., typical municipal bond yield) and allow sensitivity analysis for different η values.
Challenges we ran into
Most challenges were about giving vibe-code instructions to Plotly as it was not following the directions some times and we had to use gemini and the code section to solve the issues.
It was also challenging to make the dropdowns dynamic with the Plotly vibe coding instructions.
Accomplishments that we're proud of
Proud to have built this in less than 24h.
What we learned
It's still not so easy to direct AI to do exactly what you want but it still speeds up the building process a lot. We learned that some countries are learning from past mistakes when it comes to handling natural disasters.
What's next for The Resilience Investment Dashboard
The tool is not perfect and the UI can be improved perhaps in a more storytelling way. Provide unit conversions because now everything is in dollars.

Log in or sign up for Devpost to join the conversation.