-
-
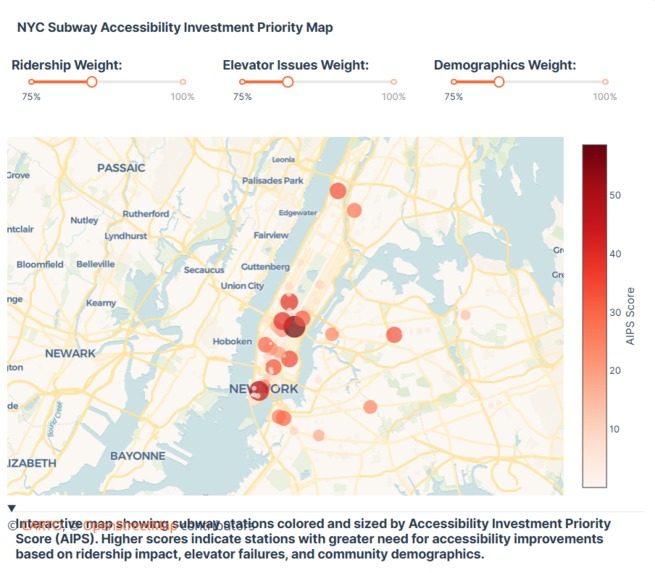
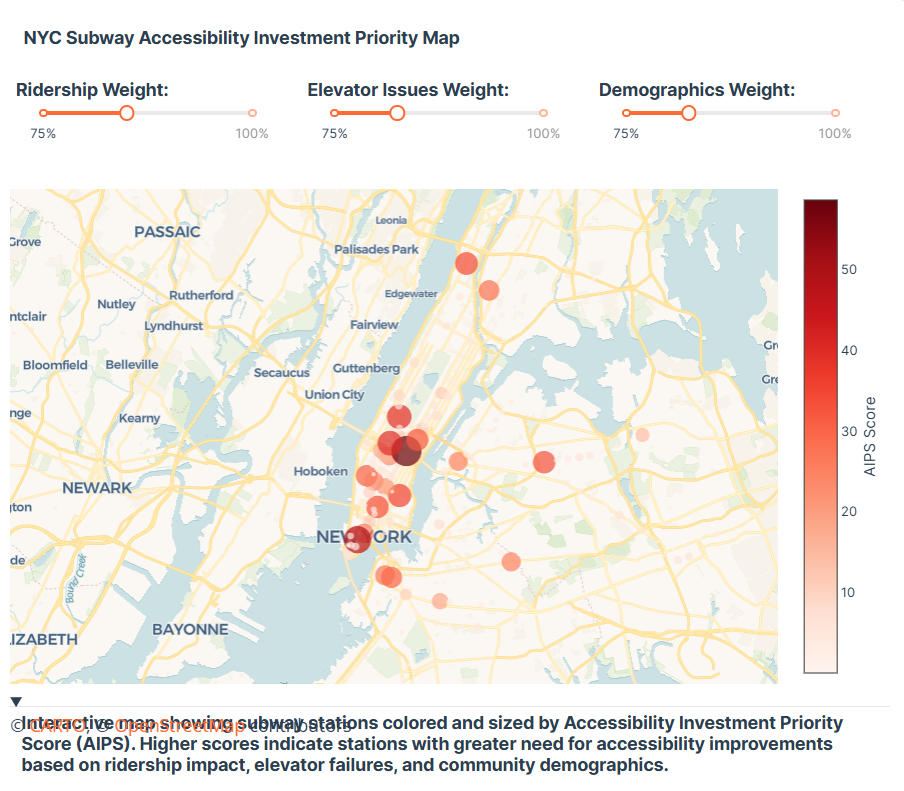
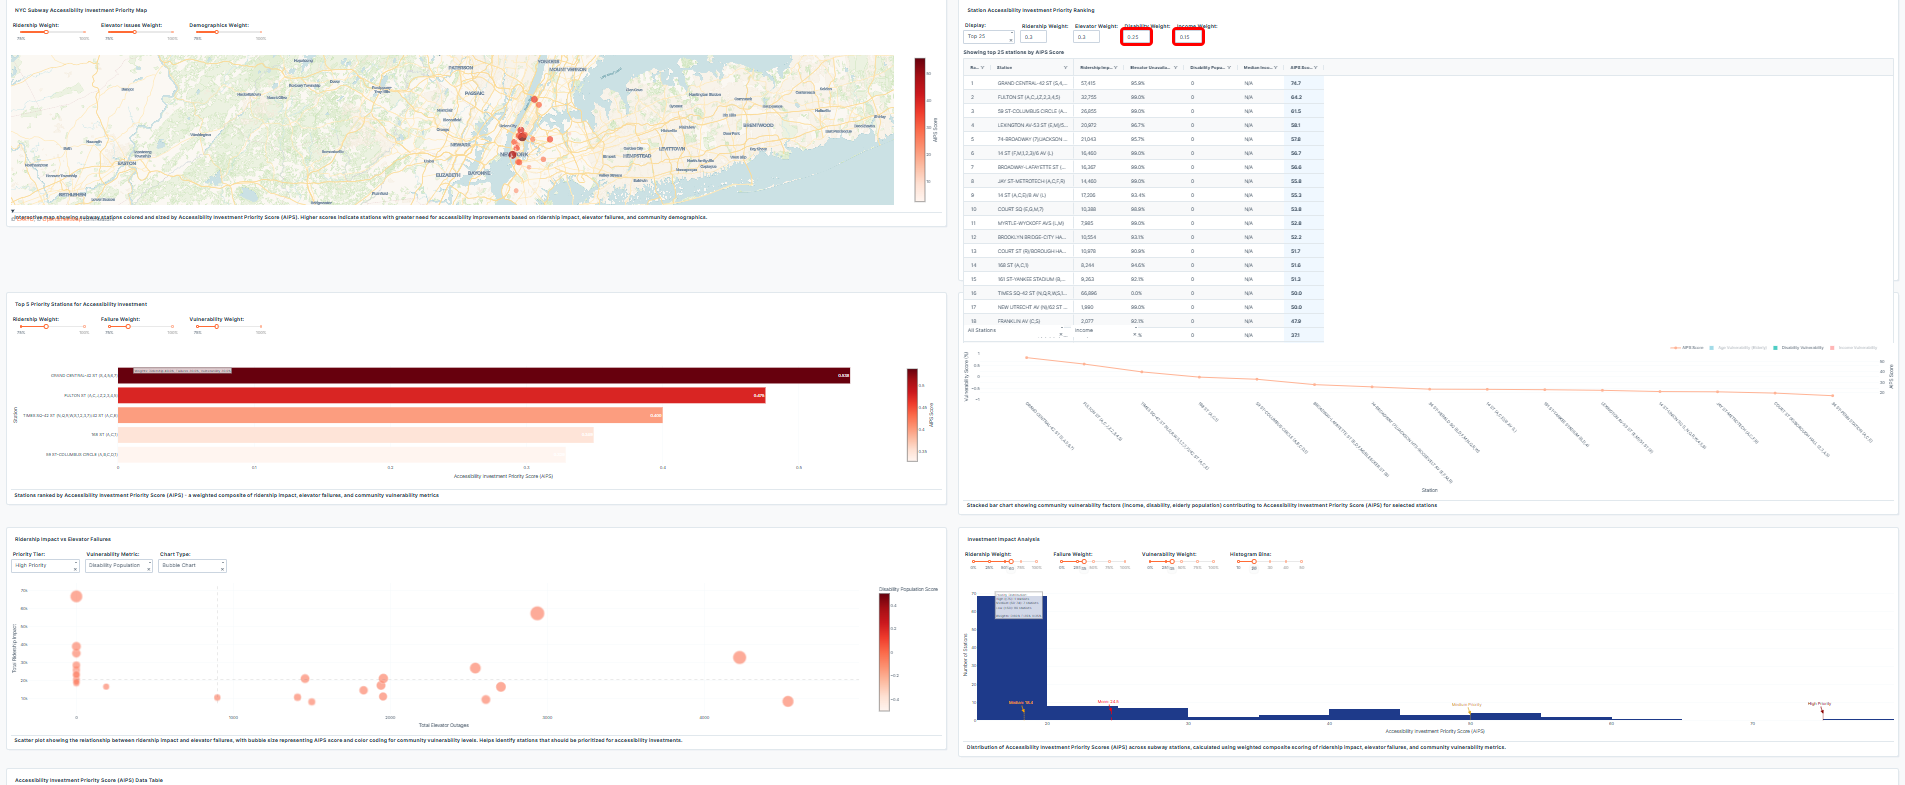
NYC Subway Accessibility Investment Priority Map: Visualizing AIPS (color & size) for equitable investment planning.
-
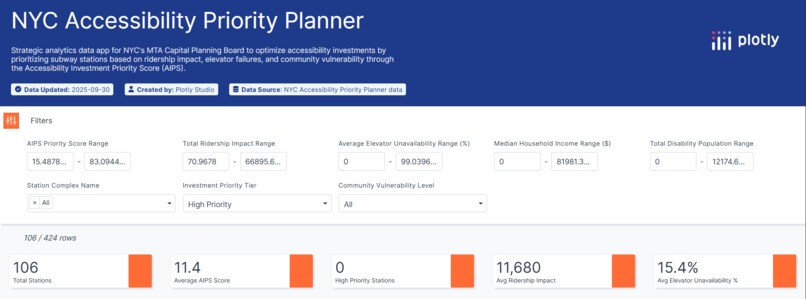
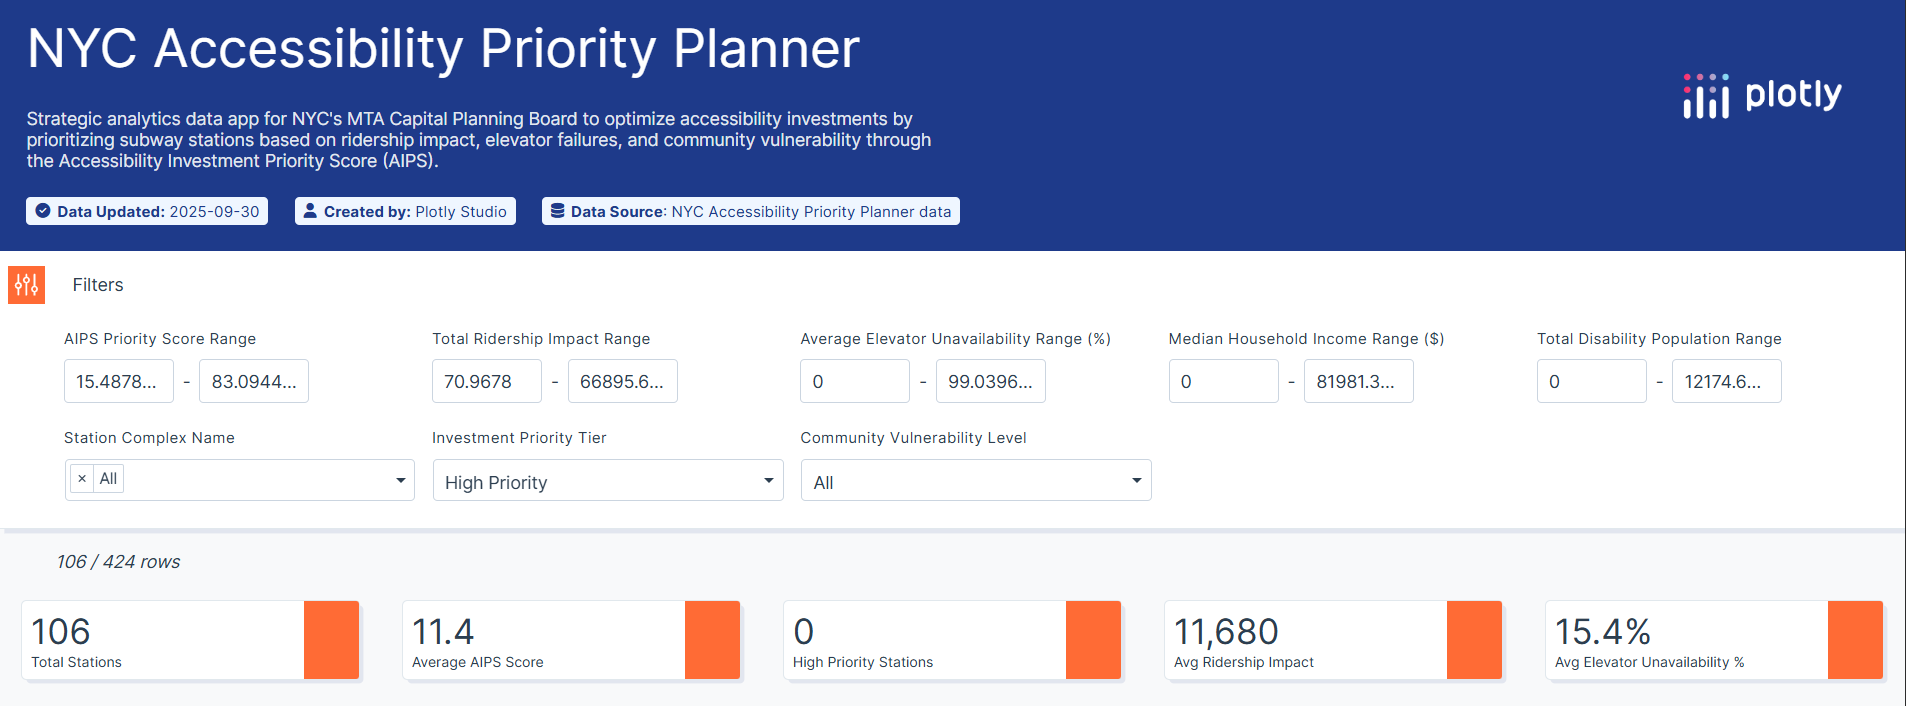
Comprehensive Global Filters & Key Performance Indicators for deep data exploration and app interactivity.
-
Granular filter panel allows dynamic exploration by AIPS, Ridership, Failure, & Vulnerability for diverse policy questions.
-
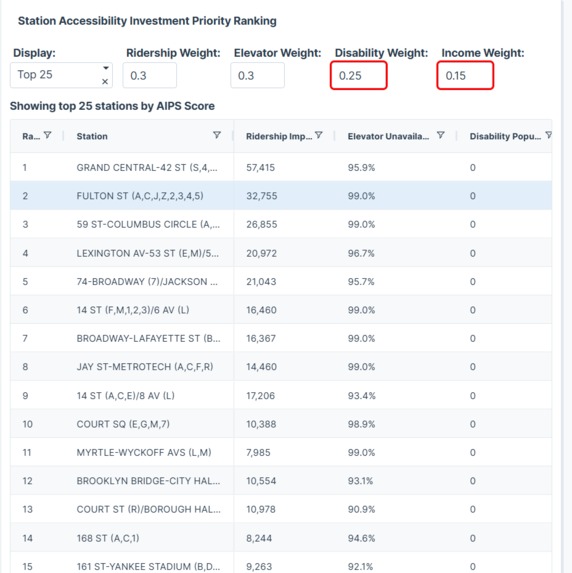
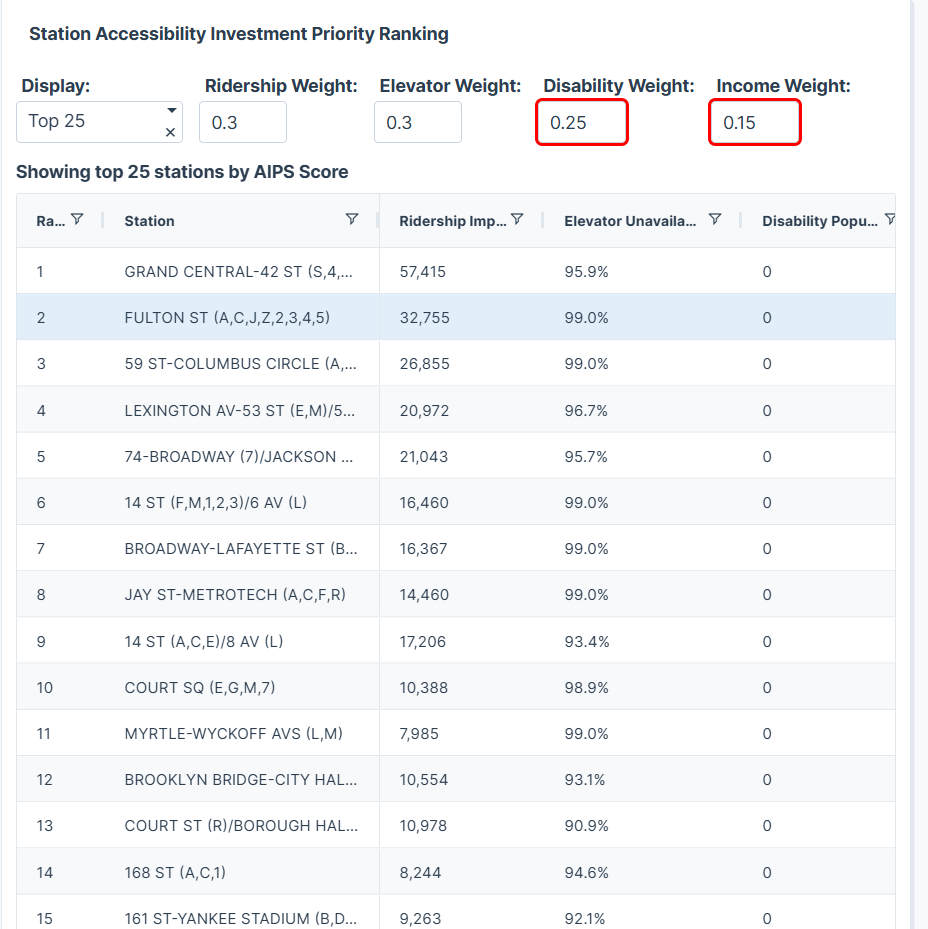
Station Priority Ranking Table: Transparent, code-backed AIPS ranking with all contributing factors for trusted decisions.
-
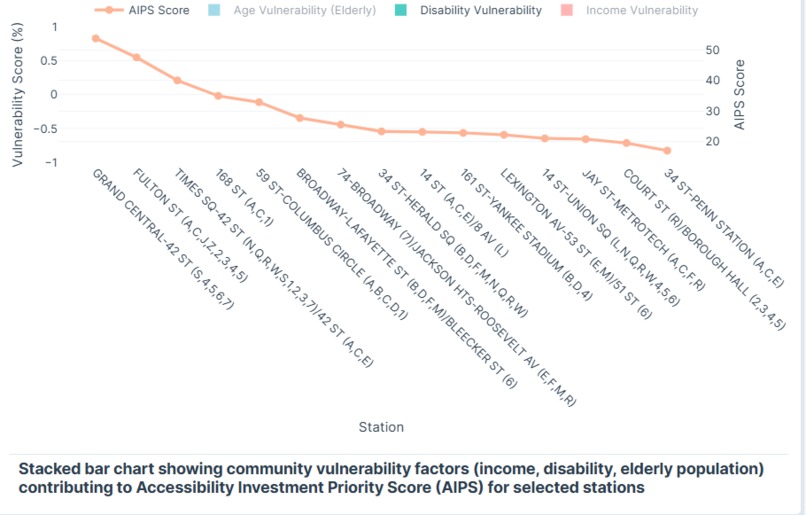
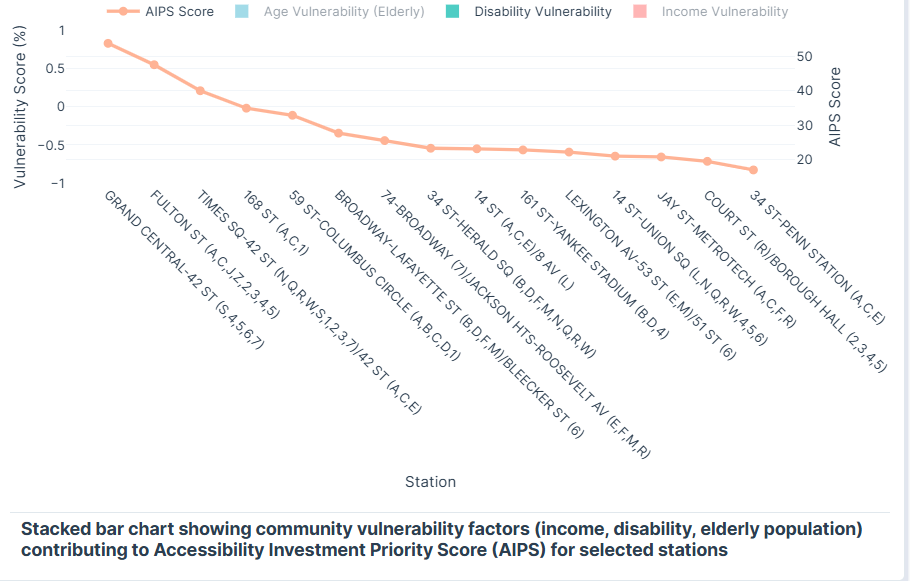
Community Vulnerability Components: Breaking down AIPS's equity factor by income, disability, & age vulnerability for targeted insights.
-

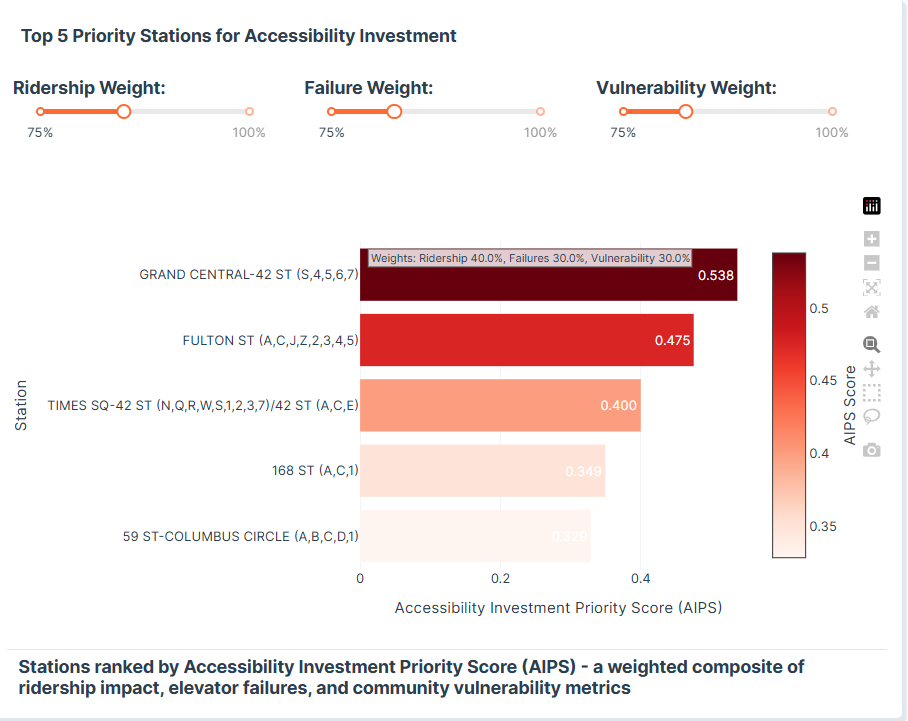
Top 5 Priority Stations: Dynamic AIPS weighting sliders allow 'what-if' scenario planning for investment focus
-
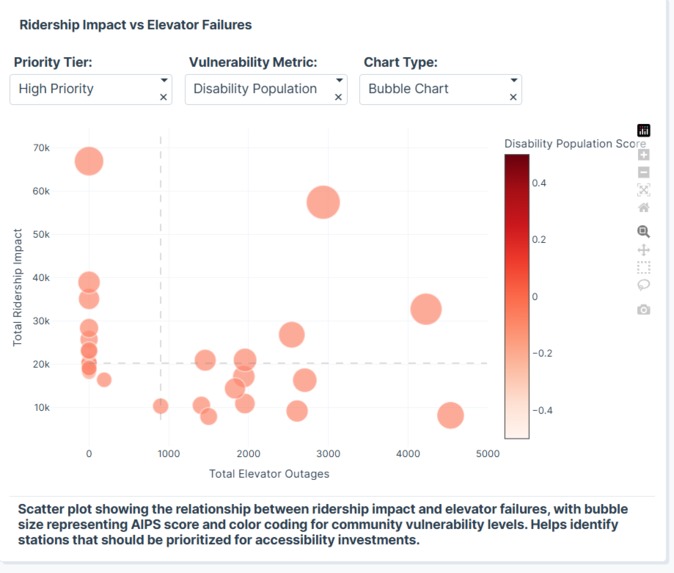
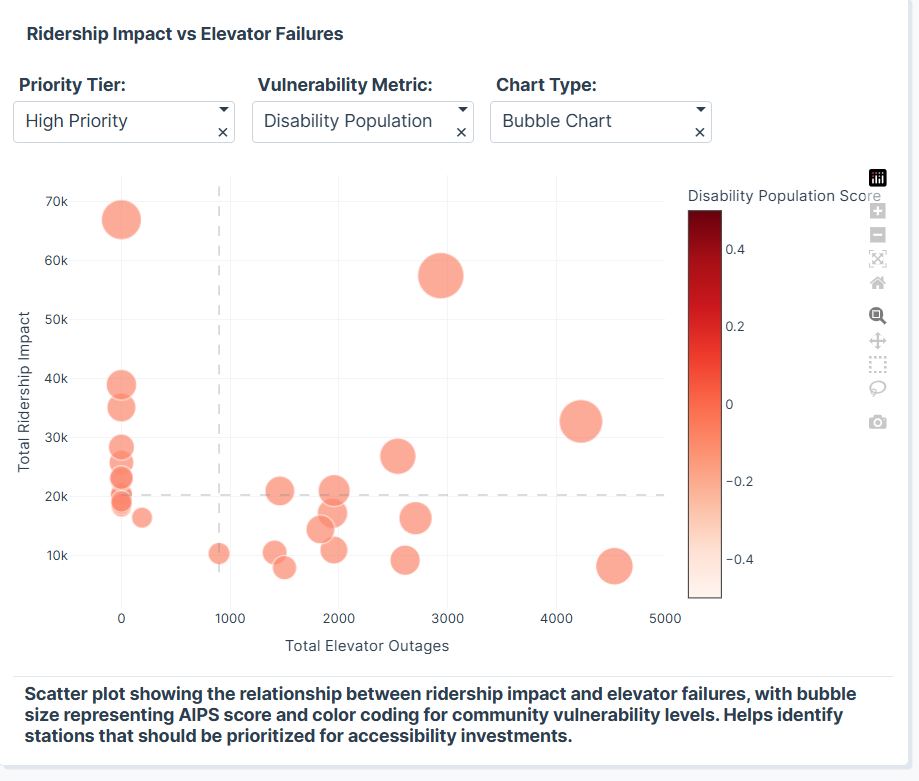
Ridership vs. Elevator Failures: Multi-dimensional visualization (size by disability, color by vulnerability) for trade-off analysis.
-
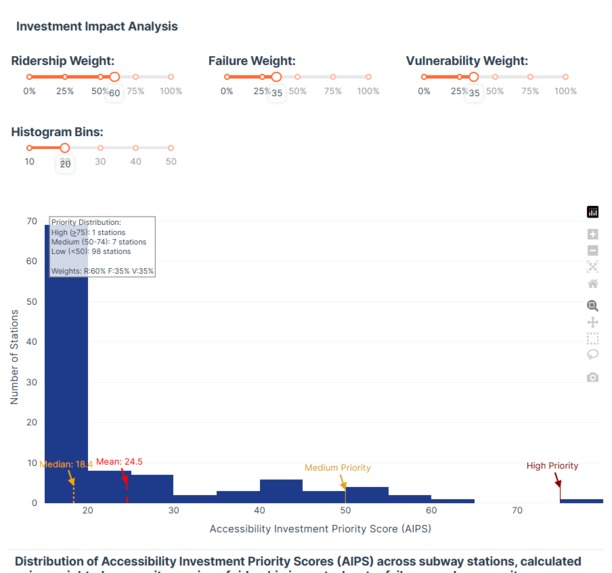
Investment Impact Analysis: Histogram shows AIPS distribution across stations, aiding strategic budget allocation and resource planning

Inspiration
Like every other New Yorker, the subway is integral to my life; it's the 7:45 AM hustle at Penn Station, the late-night quiet ride on the L, and the reliable roar beneath the city.
From my window seat, I wasn't just observing tracks; I was watching people's lives unfold. I saw the parents wrestling strollers, the delivery workers rushing to catch a transfer, and the seniors cautiously eyeing an escalator sign. The most painful observation, however, was the recurring reality: a single "Out of Service" sign meant far more than an inconvenience.
so i thought of How can the MTA make data-driven, equitable decisions for capital investments in subway accessibility, moving beyond simple compliance to proactive, community-centric planning? I recognized the need for a tool that balances operational metrics (like elevator reliability) with critical social equity factors (like community vulnerability), guiding scarce resources to where they can have the greatest impact on both ridership and vulnerable populations. This project aims to demonstrate how Agentic Analytics can bridge this complex policy gap.
What it does
The NYC Accessibility Priority Planner is an AI-powered data application designed to optimize MTA subway accessibility investments. It autonomously calculates a novel Accessibility Investment Priority Score (AIPS) for each subway station complex by fusing three critical data pillars:
Ridership Impact: Quantifies how many daily riders are affected.
Elevator Failure Severity: Measures the average unavailability and total outages of elevators.
Community Vulnerability: Assesses the demographic need of the surrounding population (based on disability rates, median household income, and elderly population).
The app then presents these insights through an interactive dashboard featuring:
A Geospatial Map visualizing AIPS by station.
A Priority Ranking Table for detailed, transparent prioritization.
Dynamic Filters for granular data exploration and scenario analysis.
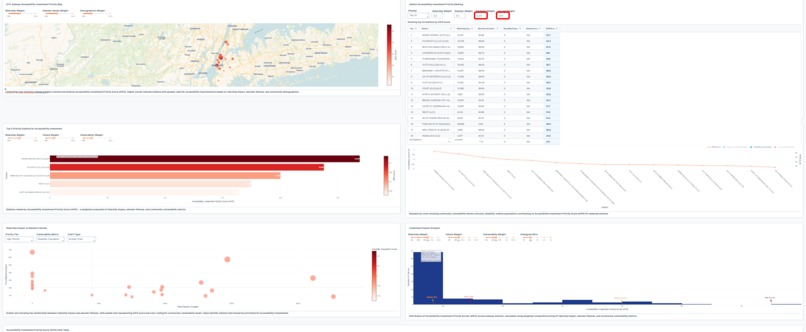
Charts for Vulnerability Breakdown and Investment Impact Analysis.
This tool provides a transparent, data-backed roadmap for equitable infrastructure planning, allowing stakeholders to identify critical investment targets quickly and effectively.
How we built it
This entire application is built using Plotly Studio's Agentic Analytics.
Data Acquisition & Pre-processing (The Foundation): I initially sourced large, disparate datasets: NYC MTA Origin-Destination Ridership data (over 1GB), MTA accessibility feature data, and multiple U.S. Census Bureau ACS 5-Year Estimates (covering disability, income, and age demographics across 90+ columns for NYC Census Tracts). A significant effort was made to clean, filter (to meet the 75MB data limit for Studio), transform, spatially join, and consolidate these into a single, comprehensive CSV for seamless ingestion by Plotly Studio. I utilized Python (Pandas, Scikit-learn) for this data engineering.
Agentic Application Generation (The Core): I provided Plotly Studio's Agentic Analytics with a single, comprehensive Natural Language Prompt. This prompt instructed the agent to:
Ingest pre-processed CSV.
Autonomously define and calculate the Accessibility Investment Priority Score (AIPS) as a weighted composite of Ridership Score, Failure Score, and a custom-calculated Vulnerability Score.
Generate a multi-chart, interactive Plotly Dash application featuring a geospatial map, data tables, dynamic filters (including agent-generated categorical tiers), and specialized analytical charts.
Deployment & Sharing (The Finish Line): The final application was then seamlessly published and hosted on Plotly Cloud Pro, leveraging its managed infrastructure for 24/7 reliability and secure sharing capabilities.
Challenges we ran into
Data Volume & Complexity: The initial MTA ridership data was over 1GB, exceeding Plotly Studio's direct ingestion limit. This necessitated Python pre-processing, filtering, and performing spatial joins across multiple large Census datasets to distill the core information into a manageable, yet analytically rich, master CSV.
Defining a Robust Composite Metric: Translating the nuanced policy goal of "equitable accessibility" into a quantifiable, weighted Accessibility Investment Priority Score (AIPS) was analytically challenging. Ensuring proper normalization and inverse-normalization of diverse metrics (e.g., ridership vs. income) required careful thought to ensure the agent's output was meaningful.
Guiding the Agent Precisely: Crafting the Prompt to generate not just any app, but this specific highly interactive, multi-chart dashboard with custom categorical filters, while balancing chart types and layout, required iterative refinement to push the boundaries of agentic control.
Ensuring Interactivity: A minor challenge involved troubleshooting a data card that did not dynamically update with filters. While not critical to the app's core functionality.
Accomplishments that we're proud of
Autonomous Generation of a Novel, Code-Backed AIPS Seamless Multi-Source Data Integration: Successfully consolidating, cleaning, and joining 5+ distinct datasets into a single, coherent analytical file that the agent could then seamlessly transform into a fully functional application. Comprehensive, Interactive Dashboard Successfully deploying and hosting the complex application on Plotly Cloud Pro
What we learned
i learned the immense potential and current boundaries of Agentic Analytics. While the agent excels at structuring apps and interpreting prompts, deep data preparation and the nuanced definition of complex metrics (like the AIPS) still require significant human expertise in data engineering and domain understanding. I gained profound insights into orchestrating AI for complex, real-world data problems, also learned that strategic data pre-processing is paramount when working with large, diverse public datasets to maximize the agent's effectiveness.
What's next for NYC Transit Plotly Engine
Incorporating predictive models to forecast future elevator reliability or ridership trends, further refining AIPS. Connecting to live MTA data feeds for real-time updates on elevator outages and system performance.


Log in or sign up for Devpost to join the conversation.