Devpost
Participate in our public hackathons
Devpost for Teams
Access your company's private hackathons
Grow your developer ecosystem and promote your platform
Drive innovation, collaboration, and retention within your organization
By use case
Blog
Insights into hackathon planning and participation
Customer stories
Inspiration from peers and other industry leaders
Planning guides
Best practices for planning online and in-person hackathons
Webinars & events
Upcoming events and on-demand recordings
Help desk
Common questions and support documentation
Sort by:
Visualizing Data
A VR game for treatment of Strabismus
PrediCare
Deep Learning Platform capable of successfully predicting the likelihood of a person purchasing an insurance option
Nestash is an impact investment platform that provide personalize investment portfolio
Techno-Social Analysis makes the Technical Analysis.
Visualizations drawn upon understanding the consumer data over six million records using information design.
Stay on top of stock movements by getting the latest related news articles through daily text messages!
Where, when and how, should we focus resources to focus contamination?
Data visualization of a medical data set in Tableau
An easy to develop and use tool for communicate crime trends reported by HPD
Adjusting the existing Smoke Detector Model to include Disability Risk factor
CivicAirbnb utilizes neighborhood-specific homesharing data to address civic issues through applied visualization.
analysis of NYC taxi data, approx 65 GB of data
Reduce the carbon footprint of your vehicle.
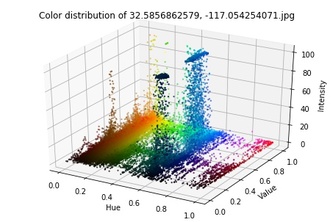
Cleaning Up Litter. One Data Point at a Time.
What month has the most homeruns?
data visualization using R, Tableau and Photoshop
VM Performance Monitor is a web based service that leverages the power of big data to optimize the GE network.
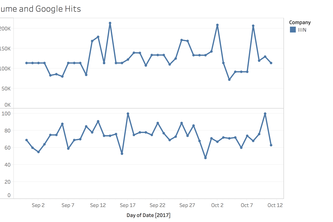
Visualizing and predicting Server Failure over time
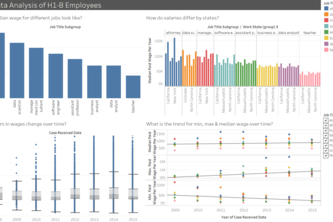
My experiment with Tableau. Have a look at the H1-B Salary Data story on the Tableau profile attached.
A voice-controlled app that allows users to take better control over their finances
I made four interesting visualizations from data collected at this very hackathon!
Analyzing and organizing data from multiple sources and visually representing it.