-
Graph
Introduction
Welcome to the project page for hype4cast, made by formidable team L.A.S.T. (Can you guess where our idea for the name came from? ;)
We are four computer engineers from Sweden, Germany and India respectively who have come together in order to learn a bit about finance and hopefully produce something useful during the process.
What we are working on
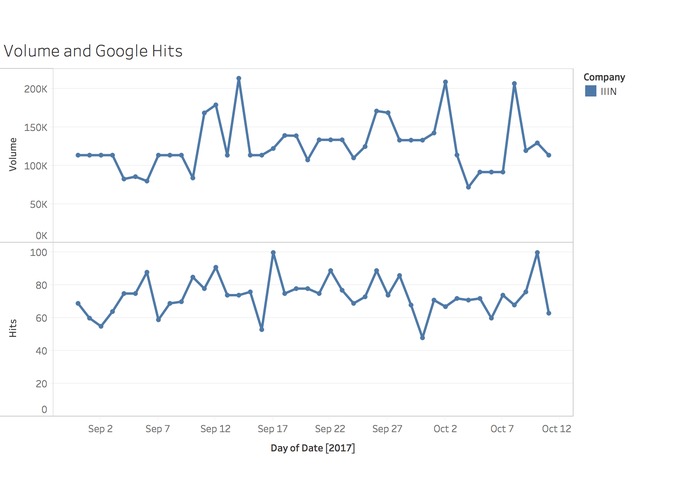
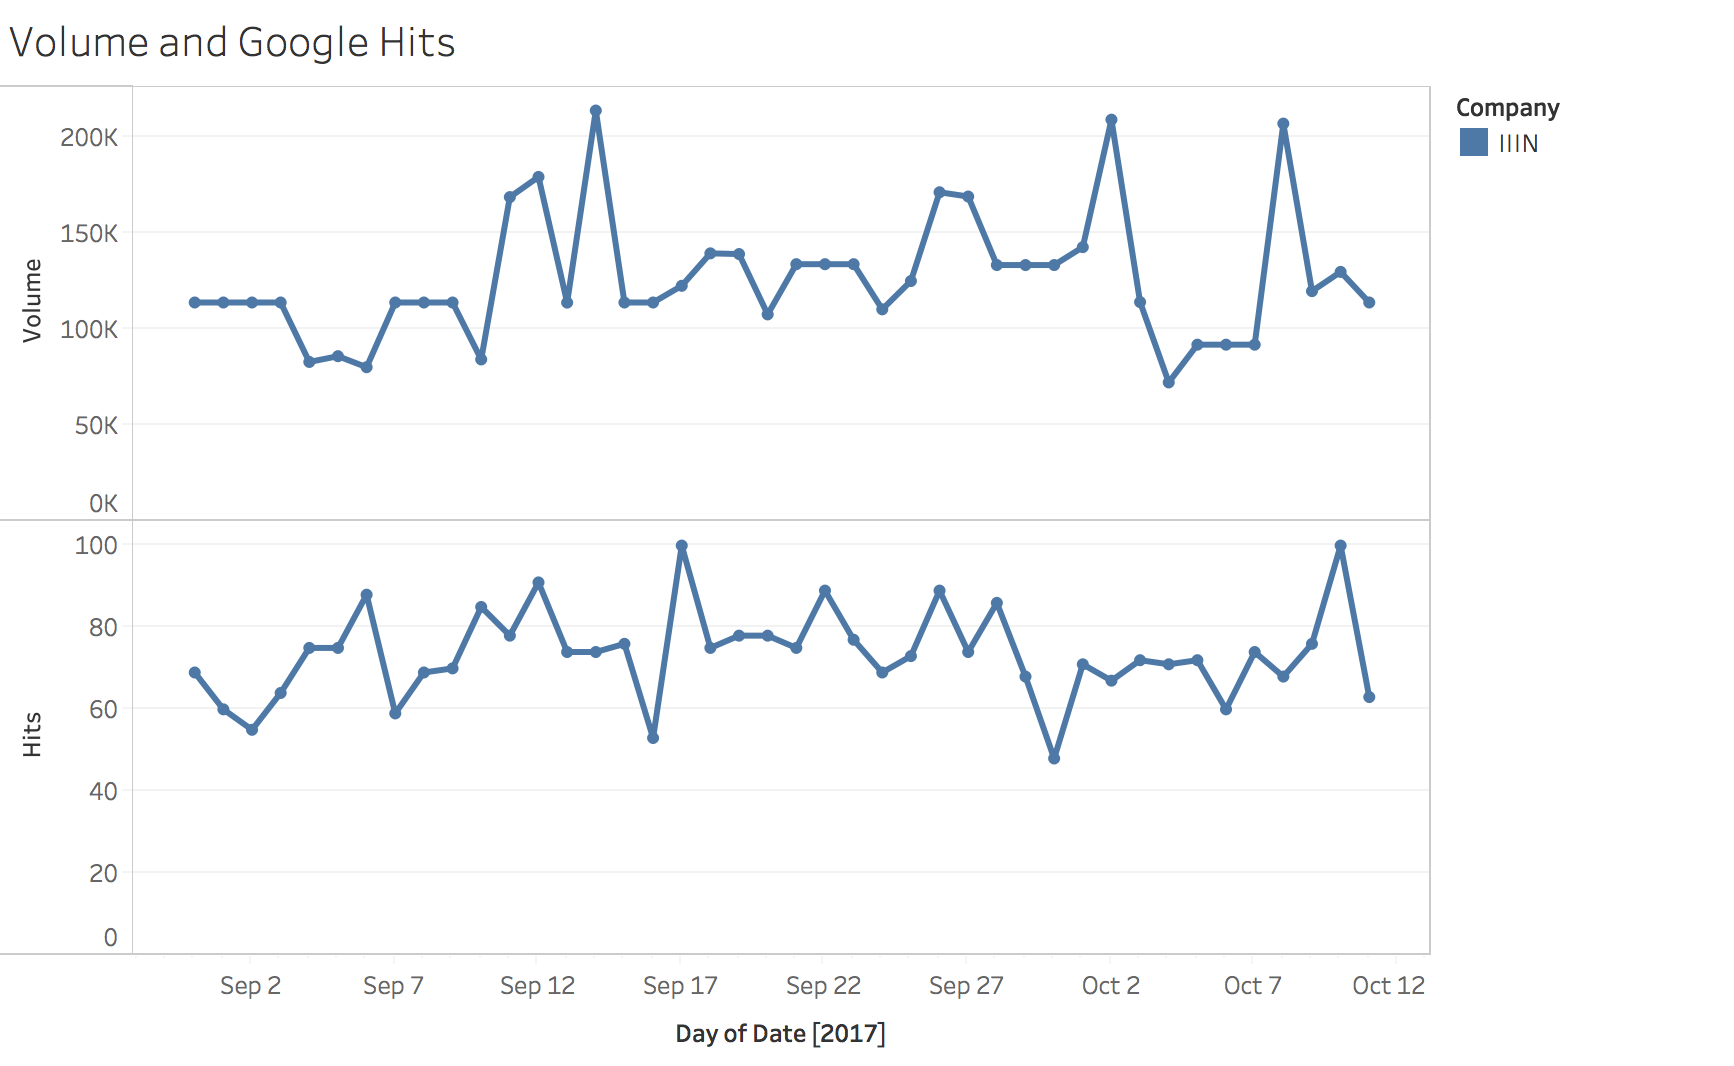
What upcoming stocks are being looked at the most? Can this influence the stock market? Hypercast looks exactly at that. It looks at trends using Data from Google Trends, Tweets and Hashtags, News outlets - and compares this data with stock market volumes in order to forecast stock volumes in the form of a newfound index named TVI (Trend-Volume-Index). This will hopefully serve as an important key number to investors who utilize technical analysis.
How we are building it
By drawing historic stock volume data from Google Finance using the google-finance API we can receive real-time info on stock volumes and price quotes. Using the google-trends-api we can also extract real-time information on different data regarding several stocks. Some examples of this are:
- Amount of Google searches for a company, stock, or ticker in a given time period (with up to 1-minute accuracy!)
- Where searches for a company or stock occur the most
Using all this data, we will for each given point in time calculate a Trend-Volume Index (TVI) which represents the likelihood of an increase in stock volume dependent on correlations between previous stock volumes and trend-data. This index can be represented in a graph over time. We will attempt to showcase a few application cases if we are given the opportunity.
The TVI-index is calculated using a set of formulae constructed by ourselves.
Who will use this product?
The TVI index is as mentioned for the use of investors who wish to increase the number of factors they take into consideration when predicting the performance of a certain stock. Just as any other single aspect within technical analysis, conclusions on performance/return shouldn't be drawn from this single index alone. The TVI is rather supposed to function as an additional tool for investors to gain even more insight into the background knowledge which will form the ground for their analysis. Assuming this, we would simply like to see the TVI as a complement to current investment platforms.
Technical Specification
Using javascript APIs, we extract information into JSON tables which we later import into Tableau where we perform the calculations and create appropriate graphs. See our GitHub for more details.
Limitations
Contrary to what many might think, this index might not be the most useful for large, viral companies such as AAPL or FB whose shares are mostly owned by investment banks and other large institutions. Rather, it should serve a greater purpose when analyzing small-cap companies which are mostly traded amongst private investors and have smaller demand. In other words, companies whose stock volumes are affected by their "hype" to a larger extent.
Accomplishments that we're proud of
Attempting to delve into the world of fintech with no formal experience in finance, and producing something useful in only 24 hours. We have definetely been introduced to a new plethora of techno-innovational possibilities within the world of finance.
What's next for hype4cast
The more data that is used to calculate the TVI, the more useful and unbiased it will be. This is why it would be interesting to further look implement several data sources in the calculations of this index such as Twitter or News Data.
Have you any questions about our project or would want to find out more, please don't hesitate to contact any of us by mail.
Built With
- google-finance
- google-trends-api
- html
- javascript
- json
- r
- tableau


Log in or sign up for Devpost to join the conversation.