Devpost
Participate in our public hackathons
Devpost for Teams
Access your company's private hackathons
Grow your developer ecosystem and promote your platform
Drive innovation, collaboration, and retention within your organization
By use case
Blog
Insights into hackathon planning and participation
Customer stories
Inspiration from peers and other industry leaders
Planning guides
Best practices for planning online and in-person hackathons
Webinars & events
Upcoming events and on-demand recordings
Help desk
Common questions and support documentation
Sort by:
User-friendly and interactive website that the public can easily gain insight into decisions made by elected judge.
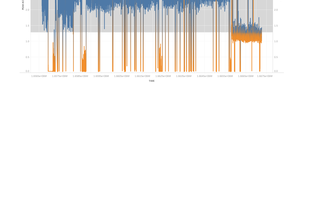
AI helps predict when machine fails using LSTM model and provides warning system for machine failure through Tableau Dashboard
A one-stop shop to aid course planning by displaying your professor ratings, course ratings, and peer ratings on one page.
Quantum is next generation 'Income Sharing Agreements' intelligent system that leverages quantitative & qualitative datapoints and information from personality Assessments
Visualizations to assist oil companies in efficiently finding and comprehending data to maximize crude oil production in the United States.
An incentive-based fitness app designed for gamers, bringing MMORPG-styled skills, stats, and cosmetics to the world of IRL fitness!
A clean and elegant habit tracker with room to customize your experience.
We're examining the relationships between vulnerability to climate change, mental health, and poverty.
Using Principle Component Analysis to improve the Flood Health Index with additional significant variables.
What geographic models can tell us about susceptibility to floods in San Francisco, and how it highlights class differences in the city.
Here we analyze the disparities between minority and economic groups and how they may be more present in flood zone areas within San Fransisco.
Our analysis showed that the temperature outside had a slightly negative correlation with the sentiment of tweets about climate change, and slightly positive tweets gained the most popularity.
The Relationship Between Political Affiliation & Greenhouse Gas Emissions in Counties Across the U.S.
We analyze how the count of wildfires and its consequences have changed over time as a function of climate change, and its indications for our climate and health.
This is our analysis of the Storm Events across the United States, with a focus on the damage caused by calamities in the Tornado Alley
Analyzing Green House Gas emissions and how they relate to industry sector.
Well-informed Data Analysis & Optimal Solution of "Natures Fury"
Consumption of non-renewable source of energy by US state from 2001-2020
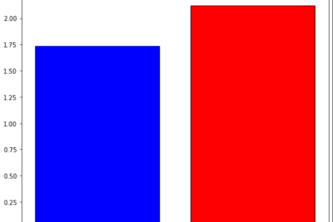
We analyze the current bias in arrest data and investigate using economical data as an alternative feature point for effective crime prediction.
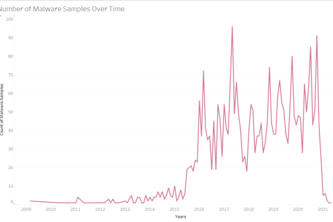
An interactive visualization of Malware Trends
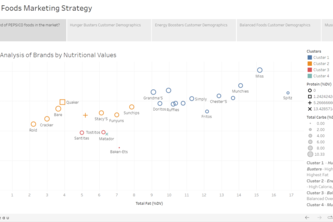
A commercial strategy to change the customer engagement dynamics of PepsiCo's brands and their associated products with the help of ML and also predicting dynamic innovative decisions out of it.
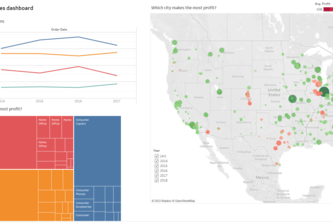
Dynamic dashboard for the sales team to evaluate their KPI in product segment, year-by-year profit and geolocation profit/loss.
Despite spending more on healthcare per capita than its peers, the US has relatively high infant mortality. We look at potential drivers of this high infant mortality rate, like race & access to care