Inspiration
We recognize the power of data visualizations when executed properly. We were inspired by the efforts of statistician Hans Rosling, who dedicated his life to better understand the world using data. Our project aims to make sense out of covid related data, test common hypotheses, draw reasonable conclusions and investigate causes if any
What it does
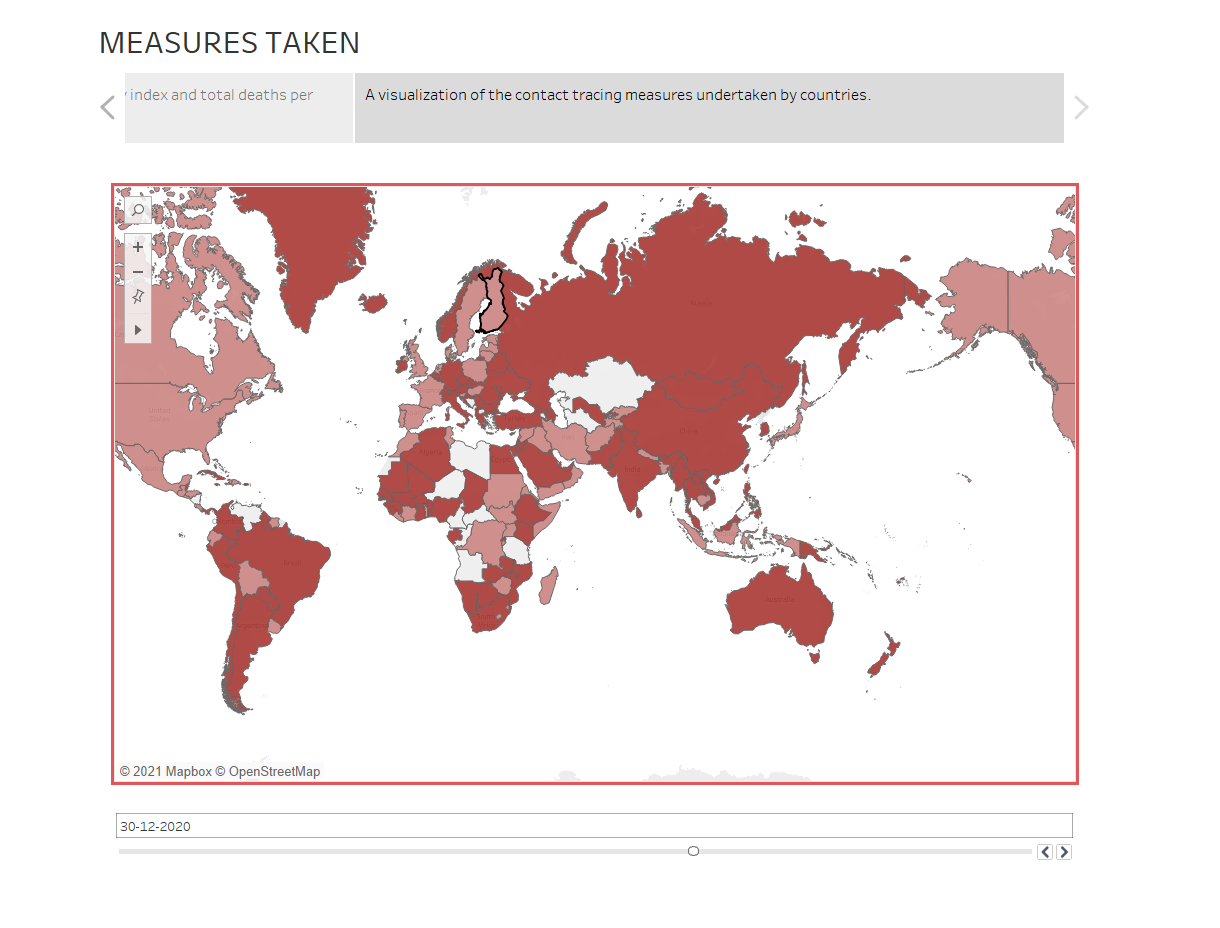
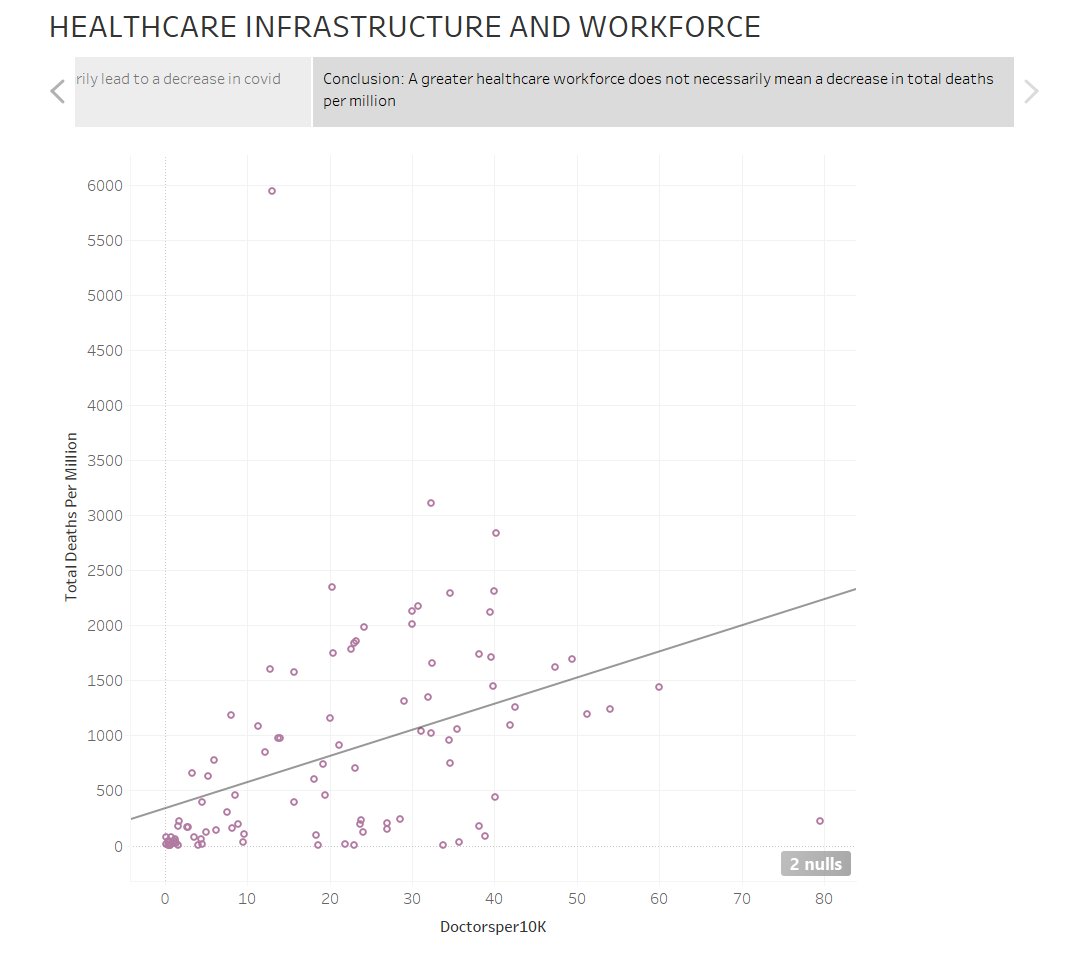
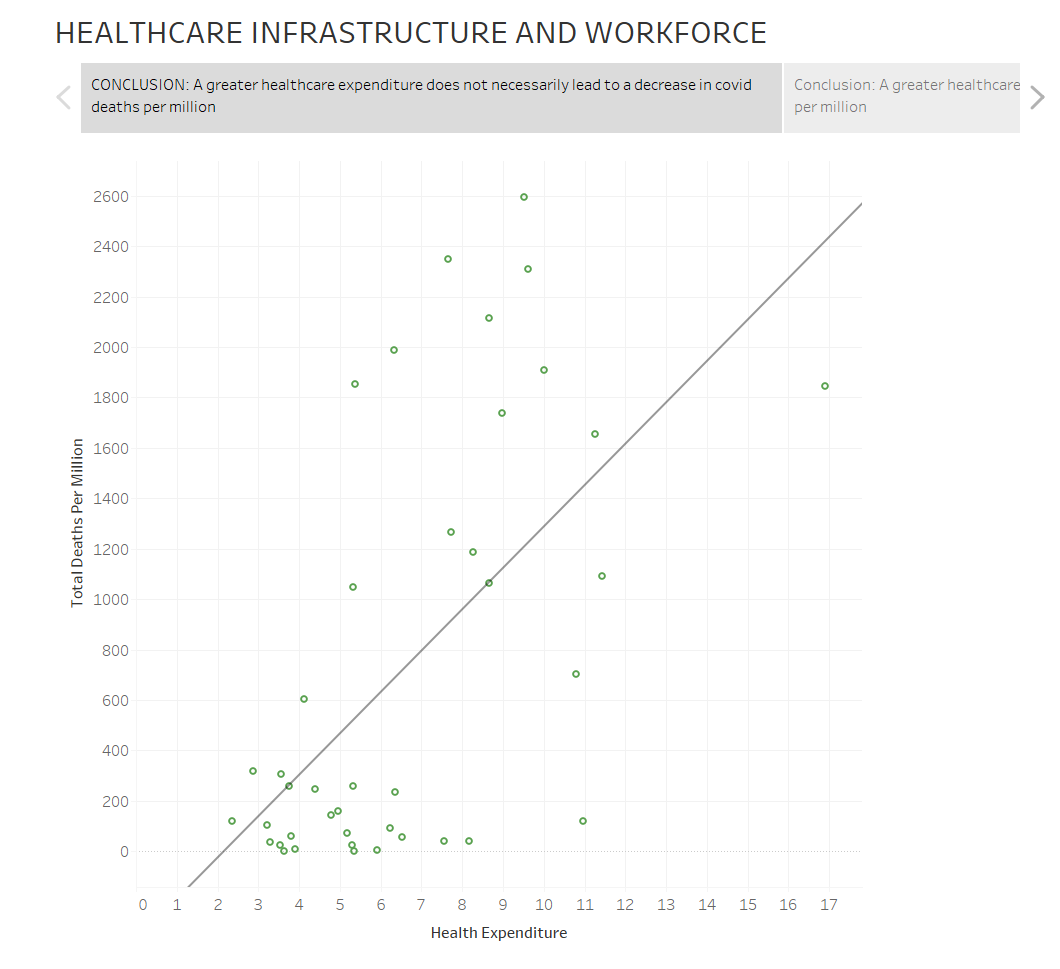
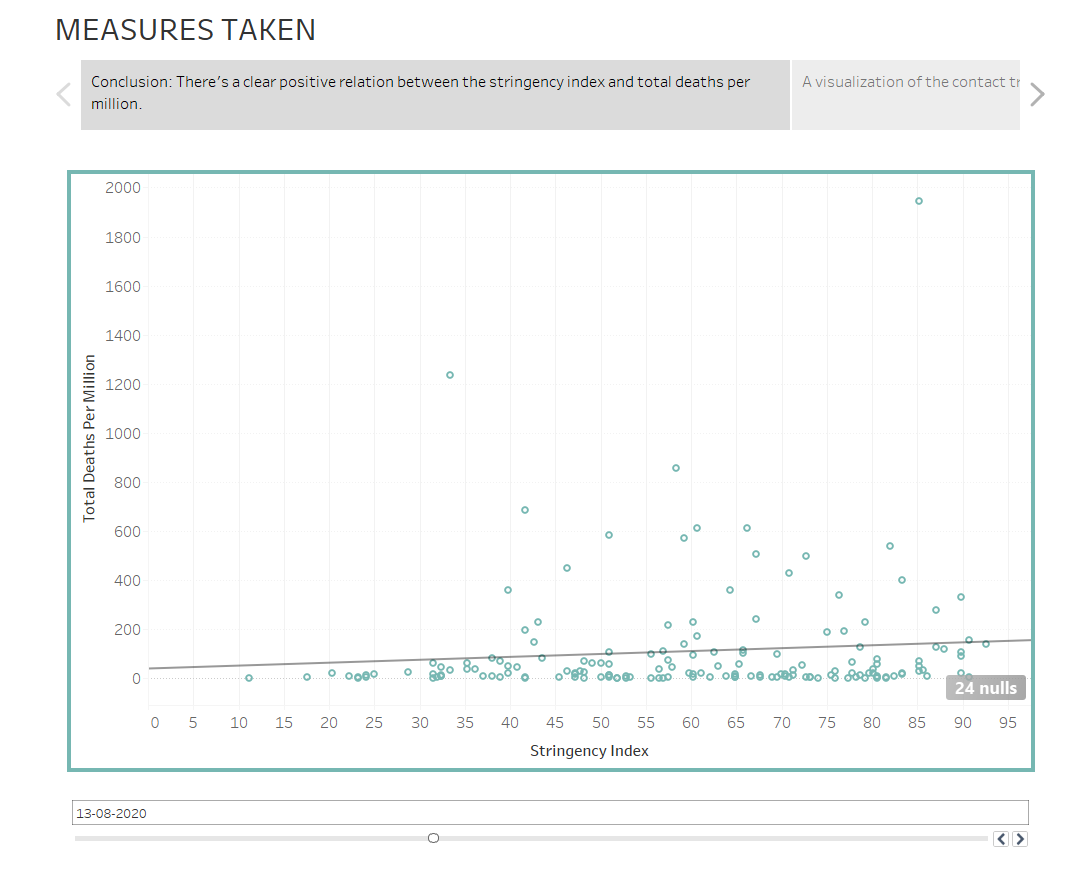
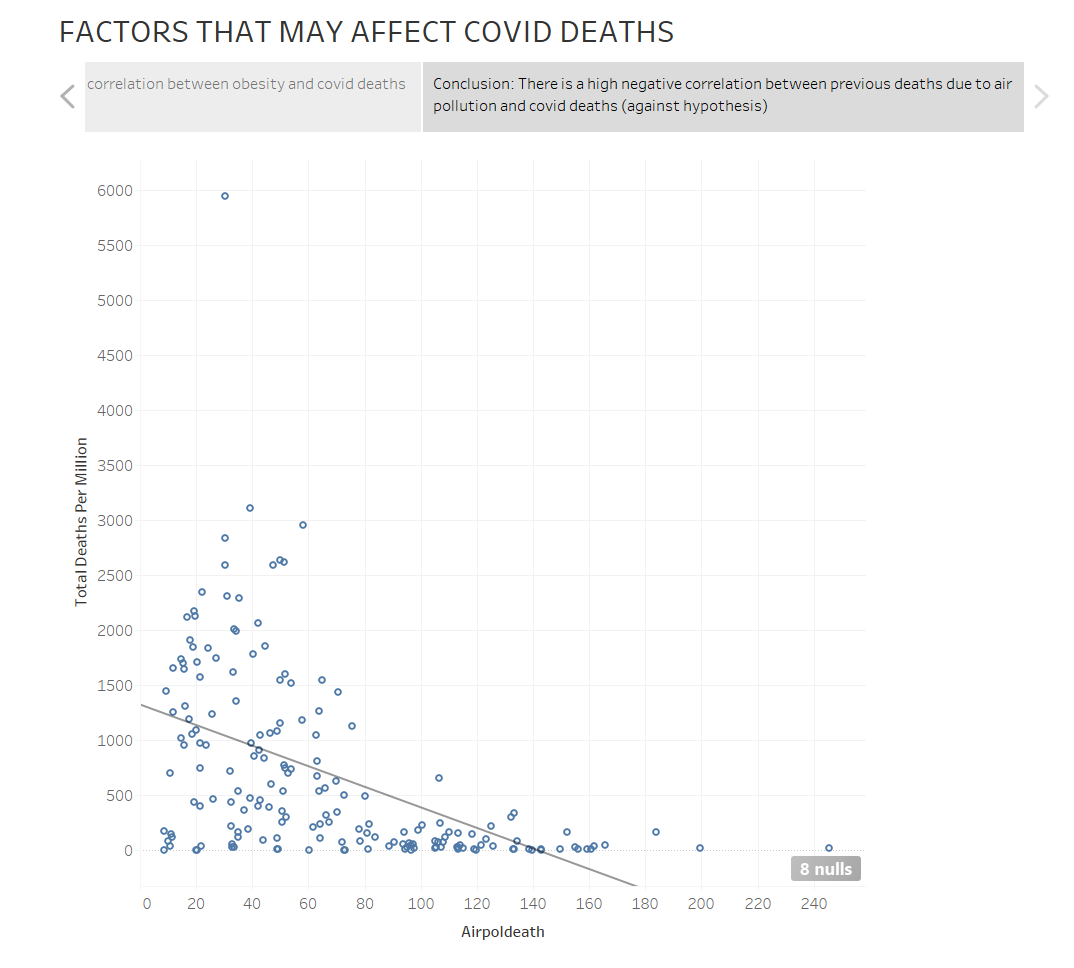
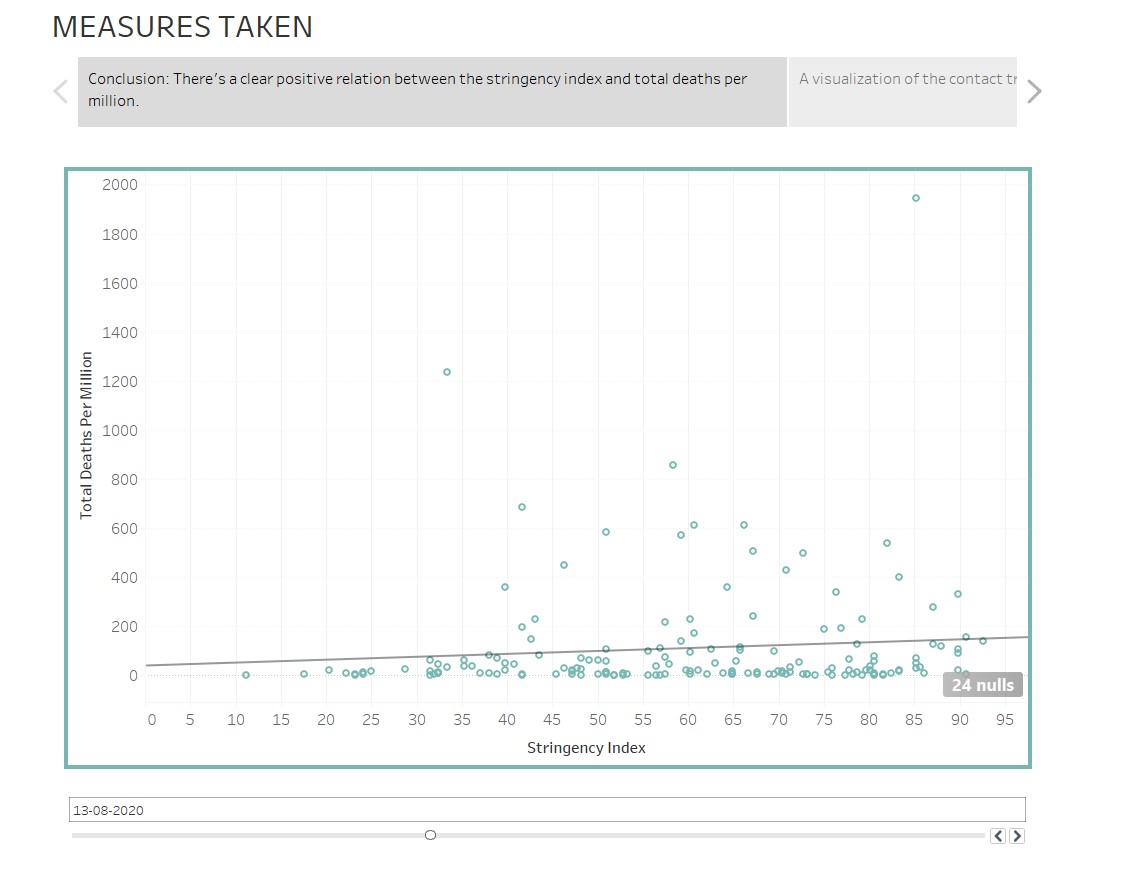
Through these visualizations, we aim to show the correlation between COVID-19 and overweight, air pollution, stringency and healthcare spending.
Our goal: In this unprecedented COVID 19 dominated world, understanding the disease and all its facets in relation to basic commodities is of utmost importance.
How we built it
We built this from scratch over two days using Pandas and seaborn of Python for preliminary analysis and Tableau for the final visualizations. Pandas enable a user to execute fast queries across many different stratifications on a dataset.
Challenges we ran into
As beginners to data visualization, we had to learn from scratch to work out the necessary applications. Some of the challenges we faced were dealing with outliers, drawing sensible conclusions from the data and the process of visualizing the important relations that we pictured in our head.
Accomplishments that we're proud of
A comprehensive summary view of each target variable with relevant scatter plots that change in relation to the time frame picked.
What we learned
How visualizations can be used to intuitively understand data and how sensitive the outcomes are to a few outliers. We also learnt the importance of being mindful of the sources, timeframe and availability of the dataset. Along with this we learnt how to use softwares related to data visualization.
What's next
Improving the interactivity for certain visualizations, comparing more variables to test hypotheses and draw interesting conclusions.
Citations
https://github.com/owid/covid-19-data/tree/master/public/data
https://www.kaggle.com/utkarshxy/who-worldhealth-statistics-2020-complete
Hasell, J., Mathieu, E., Beltekian, D. et al. A cross-country database of COVID-19 testing. Sci Data 7, 345 (2020). https://doi.org/10.1038/s41597-020-00688-8
Mathieu, E., Ritchie, H., Ortiz-Ospina, E. et al. A global database of COVID-19 vaccinations. Nat Hum Behav (2021). https://doi.org/10.1038/s41562-021-01122-8
Please use an account to view the tableau visualizations using the link given below


Log in or sign up for Devpost to join the conversation.