-
-
The better aggie map

Approach:
Our initial approach to the problem was to web-crawl through TAMU’s Transportation/Parking websites to look for/filter for related metrics. However, we quickly realized that the website’s structure as well as variability in wording was too unorganized, and that data would be unrealistic to filter through within a 24 hour period.
Instead, we handpicked a couple of websites to web-scrape with specific data that we wanted such as: parking garage pricing rates, the names of all the available permits, and a list of all the lots and garages. By using python’s built in set data structure, we were able to remove any possible duplicates in all of these lists of data.
We then used python to create the base of our datasheet, pulling the names of lots and permits and prepping the permutations of our weekday/weekend and hour columns. Once we had this initial sheet we began manually deciphering TAMU's parking webpages to fill the availability information based on our various characteristics.
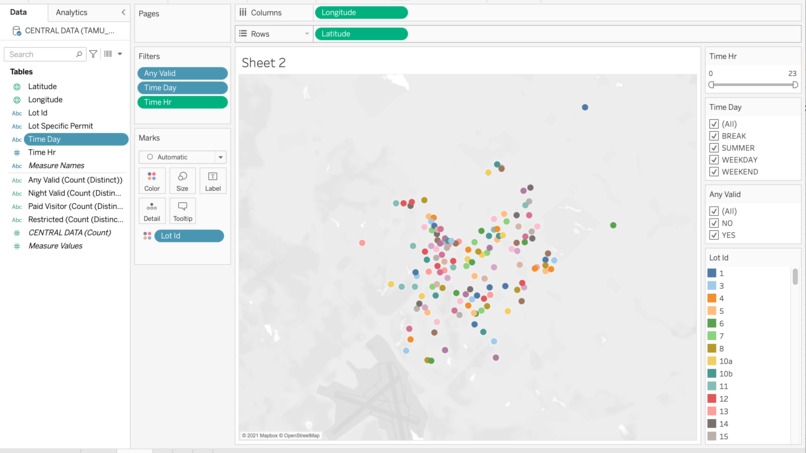
Visualization:
The visualization of our dataset is coordinate plane with each individual lot plotted, with all of the lots containing information on whether or not a selected permit and time allows for valid parking. A user will be able to select their permit type and an hour of the day they'd like to check and our map will filter out all of the incompatible lots, leaving only the unrestricted lots that they can park in. Unlike the clunky, slow and unreadable TAMU provided parking map, our map is snappy and very easy to read thanks to Tableau's filtering options.
Reflection:
Throughout the process of the challenge, the problem that gave us the most trouble would have been the finding of useful data. We had problems with crawling through the TAMU transportation site since the hrefs wouldn't always include their full url, making it difficult to weed out external links with our initial curating algorithm. So, although we were able to webcrawl and grab a large amount of data from the transportation site by searching for key terms such as “lot, garage, available, restricted, etc.”, little to none of the data was relevant due to the crawl going to site completely unrelated to TAMU parking. Thus, we decided to begin manually picking pages and scraping them.
Alongside with this scraping we had to manually synthesize most of our data since TAMU doesn't have any consistent formatting for their information about parking, forcing us to interpret their wording without using an algorithm.
We also had to create data based off of rules that were not numerically measurable. Thus, the process of development became more difficult as we had to find the different restrictions that Texas A&M puts on different passes.
Taking the time to decipher TAMU's various parking sites and creating meaningful data was the majority of the leg work for our project but we're doing this in hopes of lifting this burden off of others who just want to know where they can and can't park.
If we were given more than 24 hours, we would try to create a more robust visual system with a better interactive map than the one that is currently available. We would also try and find more aspects of our project to automate.
This was the first hackathon all of our members have ever attended which put us a bit behind others but we put in the man hours to create a product that is intended for real world application.
submission for TD Data Synthesis Challenge

Log in or sign up for Devpost to join the conversation.