-
-
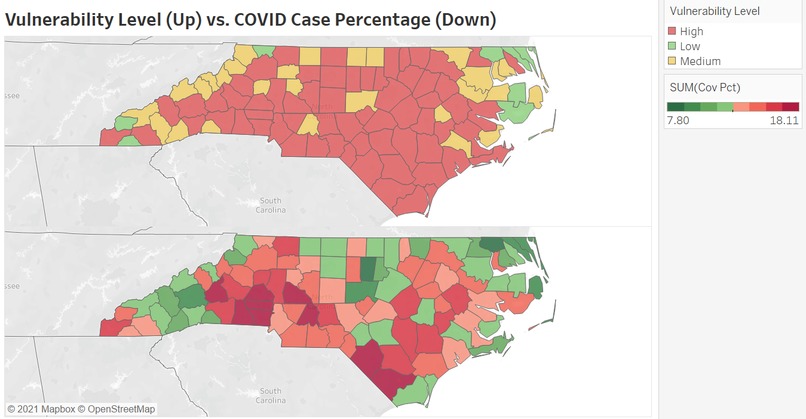
Vulnerability Level & COVID Case Percentage
-

IAA Team A for CDC 2021
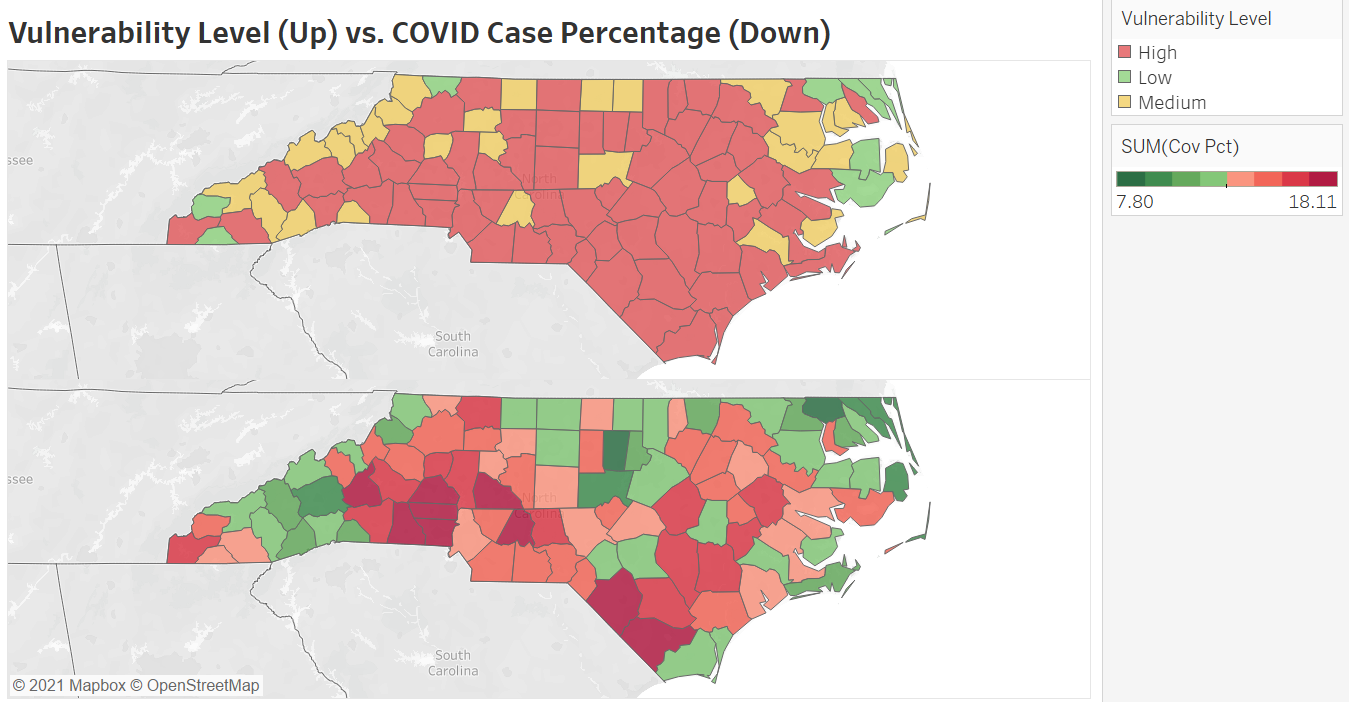
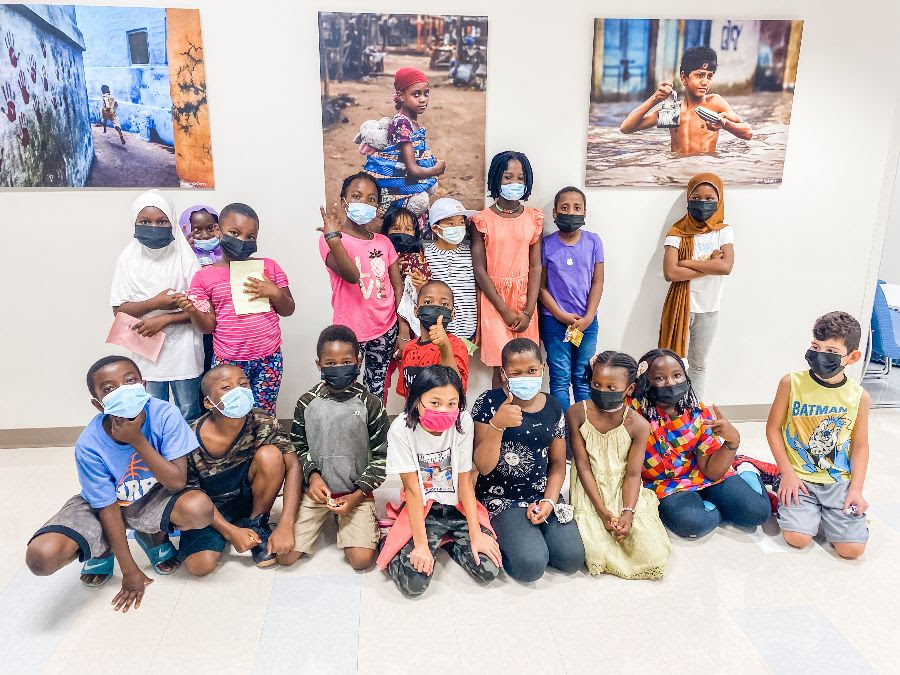
Image source: Refugee Hope Partners in Raleigh, NC link
Inspiration
Have you ever felt vulnerable? Have you ever wondered what vulnerability you might have in your life? Everyone wants to avoid vulnerability because it can undermine the joy you may otherwise experience in life.
Our team witnessed how vulnerability prevails around us when we volunteered for a refugee community in North Raleigh a month ago. Most residents in the community lack daily necessities, vehicle access, and educational opportunities due to limited access to employment and income. Living in vulnerability has become part of their life. But we can lessen that vulnerability and provide insights and suggestions that help shape a better living environment for them.
What our project does
Our project provides county-level comparisons on the social vulnerability index (SVI), along with insights into how national disasters and COVID are related to SVI. In order to focus on those populations who may need the most help in the future, we forecasted potential deaths from COVID-19 by vulnerability level. We hope this project can help public health officials and emergency response planners identify and map the communities that will most likely need support. Further, we hope it helps them prioritize their limited resources for the tracts in need most before any hazardous events.
How we built our project
We first completed some basic exploratory analysis to understand the data set, including computing summary statistics of variables and imputing missing values. We then visualized the SVI of each NC county in each theme and tried to explain these distributions using other variables within the dataset. Ultimately, we realized that it would be valuable to combine the SVI data with external data sets, so we completed the further analysis using US disaster and COVID-19 data sets.
Analyses we did
1. Disaster Analysis
We compared the number of disasters that happened in the US since 2000 with the vulnerability level average for each state to see the states we should focus on more in the future. We found that Texas was the state with the highest vulnerability level and the number of disasters. Also, we did the same analysis for each county in North Carolina and Texas.
2. COVID-19 Analysis
We created a Vulnerability Level (High, Medium, and Low) variable using the F_TOTAL variable provided by the SVI dataset. We chose the thresholds to create this variable by looking at the percentiles (0.3 and 0.7) of the F_TOTAL variable. We matched this Vulnerability Level with each county in the COVID-19 dataset. Then we analyzed how the COVID-19 cases and deaths increased differentiated by Vulnerability Level. We found that the groups with the highest Vulnerability Level had increased their COVID-19 cases and deaths faster than those with a lower Vulnerability Level. We also made some summary statistics for each Vulnerability Level to see how different they are for each social variable provided by the CDC.
3. COVID-19 Death Forecasting by Vulnerability Level
We created a predictive time series model to forecast COVID-19 deaths after October 31, 2020, for each Vulnerability Level. We also generated our three forecasting models using Long Short-Term Memory (LSTM), getting good prediction metrics on average:
- RMSE: 0.0204%
- MAPE: 7.9%
We predicted the deaths due by COVID-19 for the following 75 days after October 31, simulating a scenario where vaccines weren't distributed among the population. We found that the forecasting for the High-Vulnerable group increased its COVID-19 deaths exponentially, showing that populations with fewer opportunities and more vulnerable can suffer disastrous consequences when facing disasters such as the COVID-19 pandemic.
Challenges we ran into
Our team was challenged by the complexity of the data set and spent a significant amount of time trying to understand the meaning of each variable, which were important or redundant, and the relationships between variables. Some members of our team were also challenged by our relative unfamiliarity with tools such as Python and Tableau.
Accomplishments that we're proud of
We are proud of carrying out analyses with datasets that we are not familiar with. Combining external datasets with an internal dataset (CDC's SVI), we were able to obtain more insightful perspectives on the internal dataset and the relationship between datasets. We’re also proud of using novel machine learning algorithms, such as Long Short-Term Memory (LSTM), to forecast COVID-19 deaths across time.
What we learned
We learned that a significant amount of counties in NC have a high level of vulnerability and that there is still much that could be done to improve the aid that these communities receive during disasters such as COVID-19. We also learned how difficult it is to derive insights from a large and unfamiliar dataset in only a week’s time, and that data analysis relies on a solid understanding of the underlying data set.
What's next for Addressing Vulnerability During Disasters
We are excited to continue exploring new data sets and learning how to use data for good!


Log in or sign up for Devpost to join the conversation.