Devpost
Participate in our public hackathons
Devpost for Teams
Access your company's private hackathons
Grow your developer ecosystem and promote your platform
Drive innovation, collaboration, and retention within your organization
By use case
Blog
Insights into hackathon planning and participation
Customer stories
Inspiration from peers and other industry leaders
Planning guides
Best practices for planning online and in-person hackathons
Webinars & events
Upcoming events and on-demand recordings
Help desk
Common questions and support documentation
Sort by:
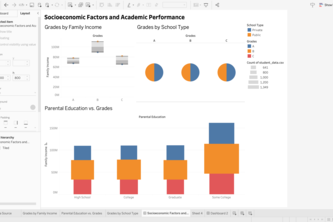
Examining Socioeconomic Influences on Academic Achievement in Major Economies
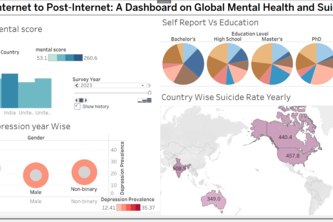
Explore mental health pre- and post-internet in our dashboard, revealing shifts in anxiety, loneliness, and burnout. A tool to understand digital impacts and inspire healthier online engagement.
We explore mental health of people during pandemic
This report examines the impact of various factors on academic performance, focusing on social media usage, bullying experiences, study environment, and attendance.
The assassination of Archduke Ferdinand in the 1914 ignited WWI leading to the collapse of empires. This project explores how the world might have been different if the assassination had not occurred.
Cheers to Balance
Revealing hidden links in global happiness, education, and social media.
Discover Syracuse: Where Every House Counts!
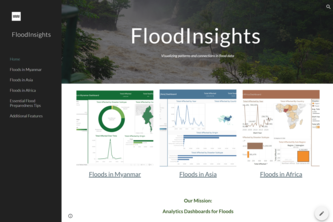
Visualizing patterns and connections in flood data
Turning complex data into actionable insights for informed, eco-friendly decisions.
Say goodbye to “good” or “bad” labels! Housing Realities uses data to unveil the real stories behind neighbourhoods. We challenge assumptions and provide insights that empower homebuyers.
Tableau dashboard for Fannie Mae
Analysis of U.S. home values and climate risk by combining Zillow data with FEMA's Expected Annual Loss Ratio. The result is an interactive map showing how property values correlate with climate risk.
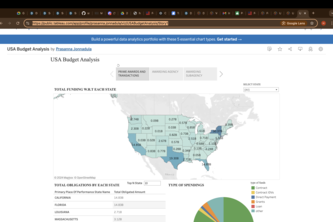
This data visualization project tracks and analyzes the dollars spent by the US Treasury using advanced analytic tool such as Tableau and Python.
Using state and county data from various souces, we are trying to analyse the factors affecting the house prices and affordability.
Collect enviromental data in the building through IoT devices. Collected through Azure IoTHub, stored in Azure SQL Database, then visualized in Tablaeu.
Empowering Communities, Enhancing Safety: Track Crime in Real-Time!
BudgetBot uses pre-trained LLMs to make federal spending data from USAspending.gov more transparent and understandable with data driven insights.
"Visualizing Climate Change: A Web-based Storytelling Platform Powered by NASA Open Data."
Our team discovered basic insights on the decline of the monarch butterfly population by cleaning, preparing, analyzing, and visualizing pesticides and sightings.
An AI-driven platform that combines personalized financial planning, mental health support, and sustainable financial practices to improve the well-being of healthcare professionals.
How COVID impacted CO2 emissions due to flights
Using US Airline Flight Routes and Fares 1993-2024
Identifying trends and relationship between Pneumonia, COVID, and influenza deaths and flight travel by state in the US from 2020-2021.