-
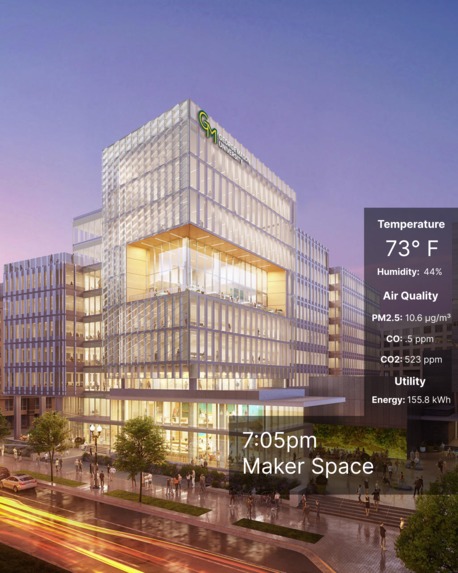
Mockup for In Building Display of enviroment data
-

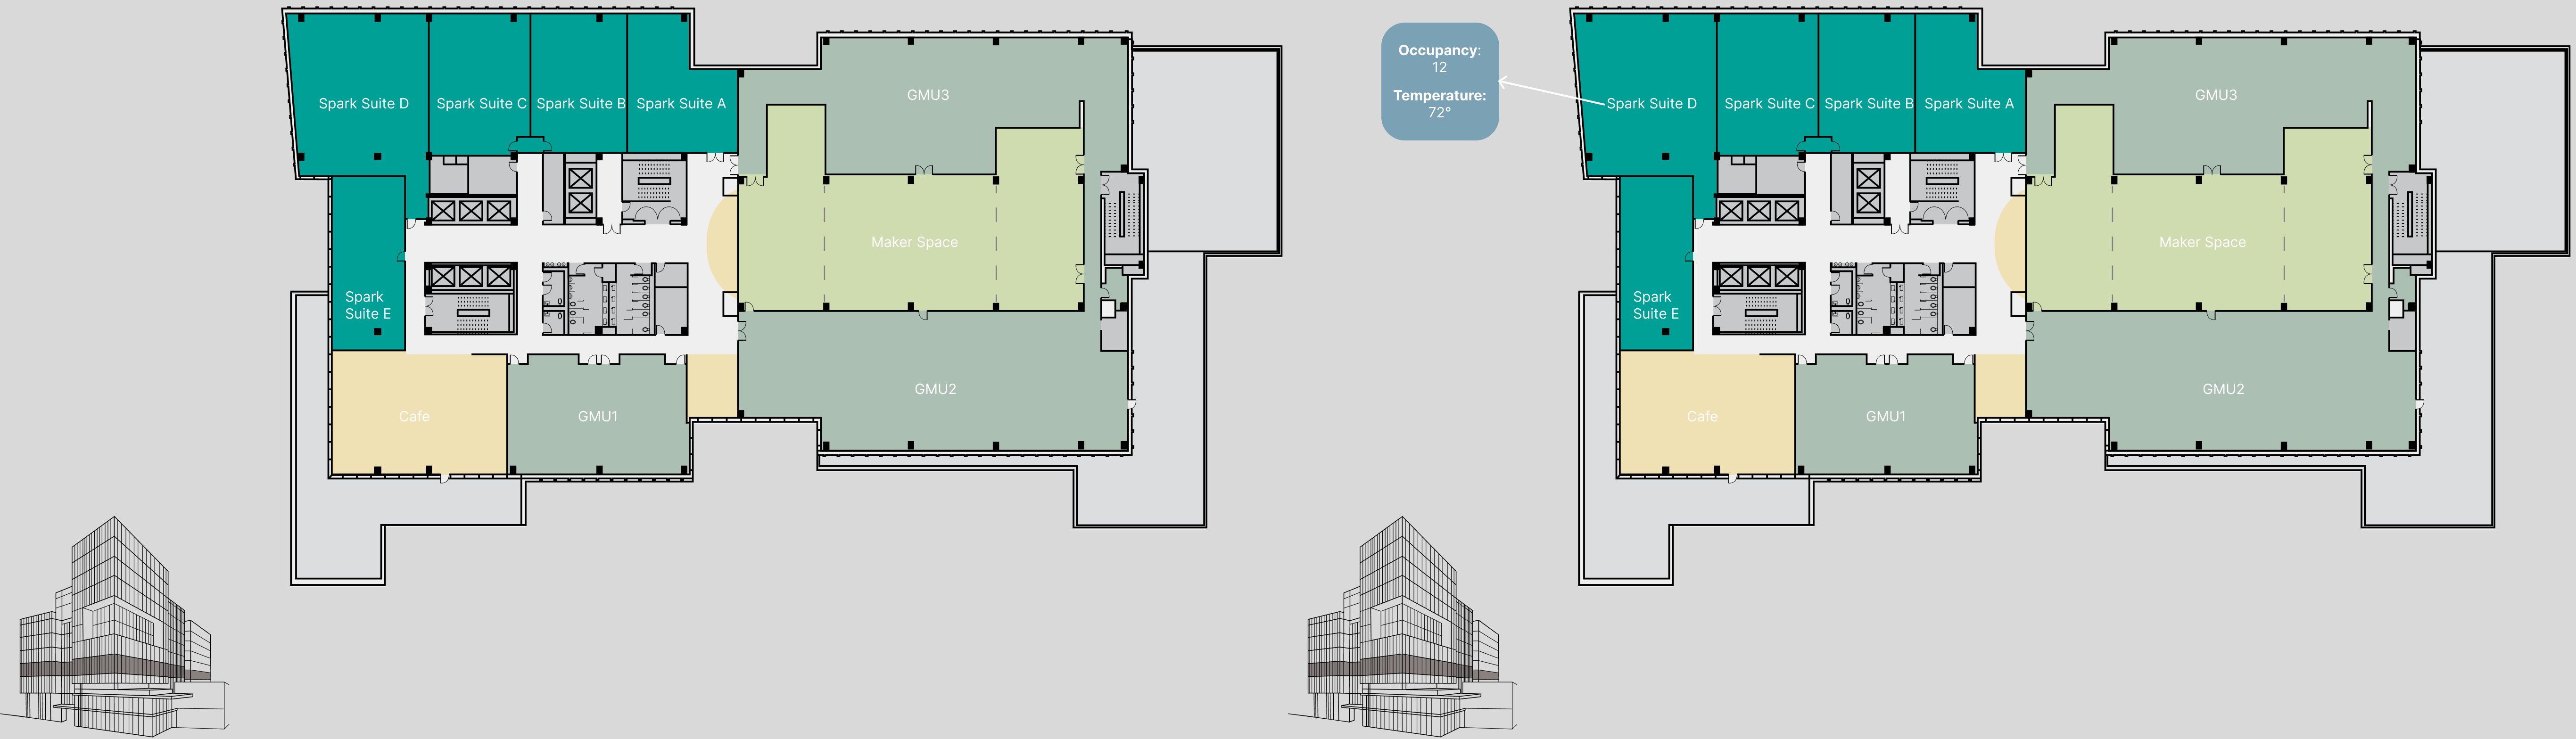
Example of Bulilding Map using enviroment data
-
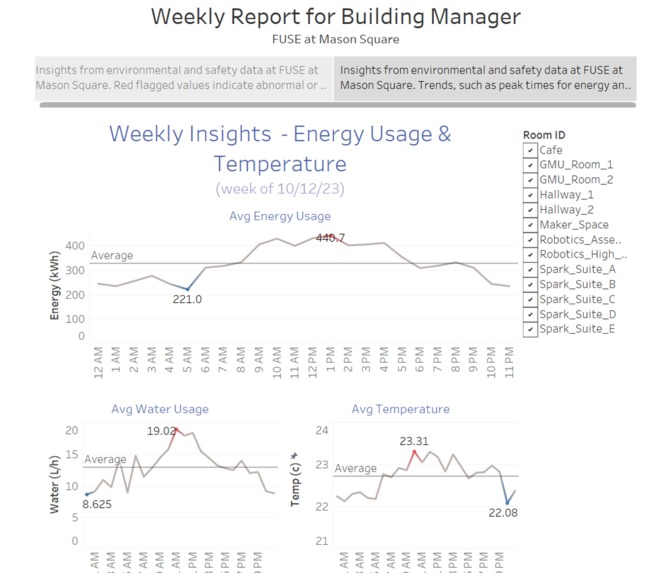
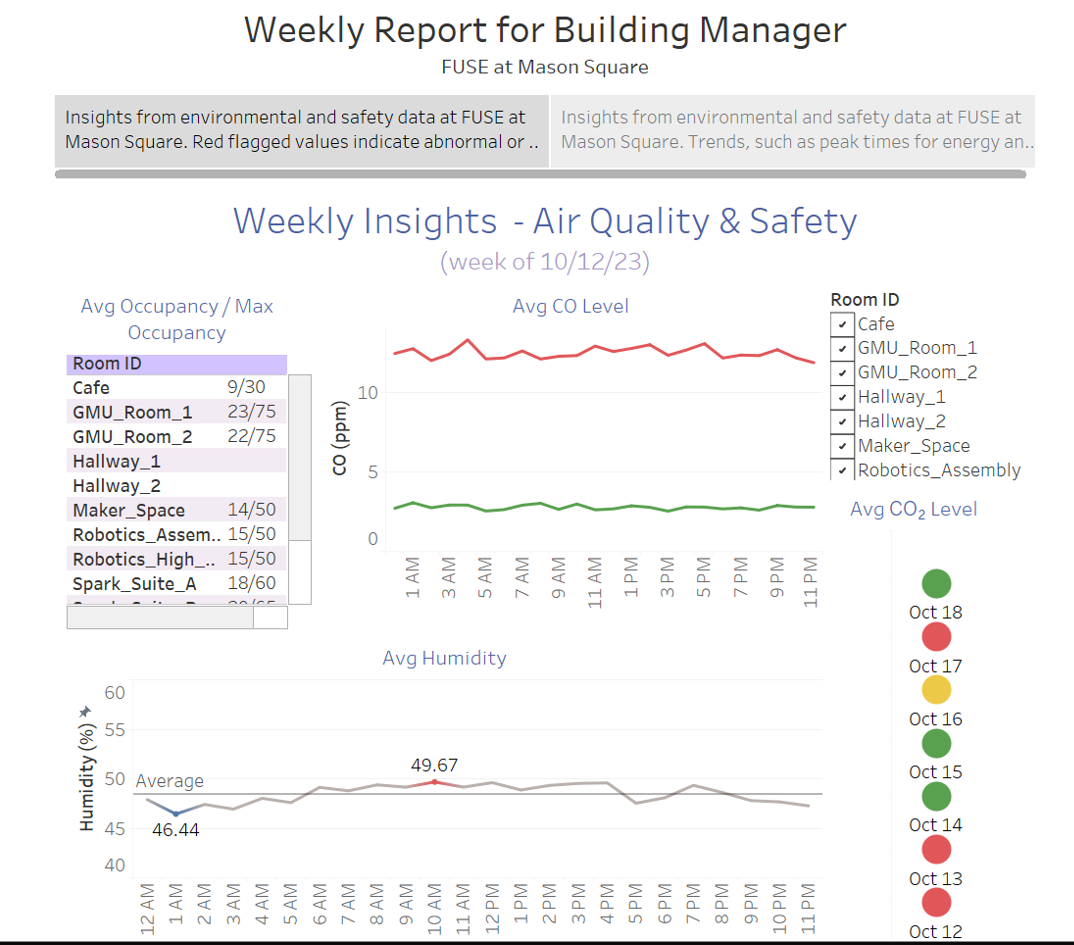
Tableau Dashboard 2
-
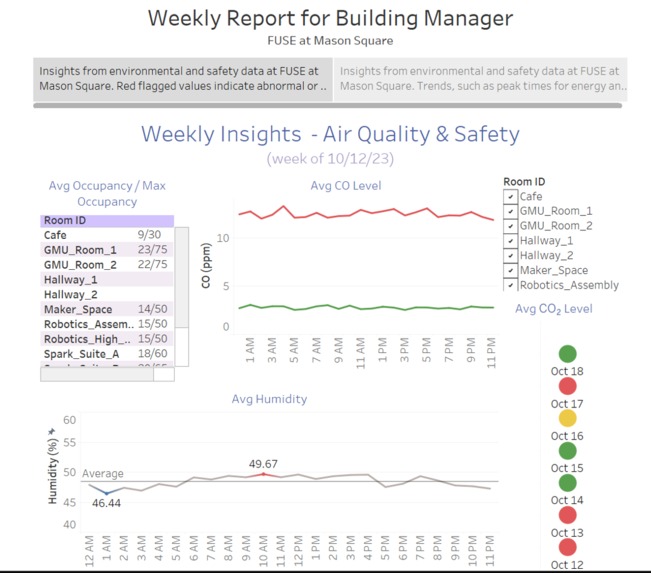
Tableau Dashboard 1

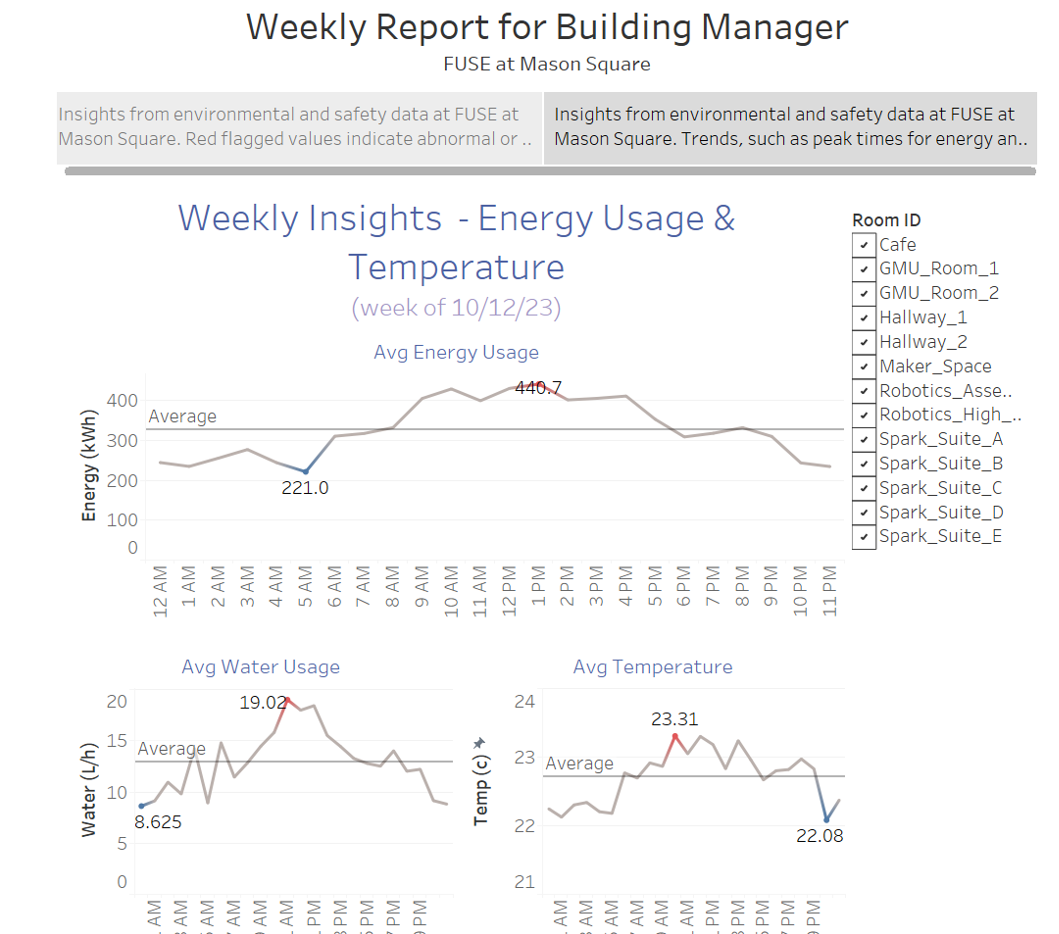
Inspiration
The idea is inspired by enviromental goals of the new Mason Square building in Arlington.
What it does
It aggregates enviromental data for use in visualizations for stakeholder and api to display real time data around the building to engage the community around Mason Square's enviromental efforts.
How we built it
Collected building IoT data via Azure IoTHub, piped to Azure SQL database via Azure Stream Analytics. Then exported to tableau for visualization.
Challenges we ran into
Lots of issues get the services/connections right for azure to work together. Issues creating the spoof IoT data. Learning how to make good tableau visualizations.
Accomplishments that we're proud of
Getting working components of the project! Not everything is working, but given its our first hackathon, we are proud of what works! Specifically IoTHub collection and the Tableau Visualizations.
What we learned
Almost everything is new for us in this project, so azure was learned, tableau was new, and many more
What's next for Mason Square Enviroment via IoT Data
Expand functionality, consider more factors when doing ML modeling (air flow rates effect on PM in a room), creating some apps for the api.


Log in or sign up for Devpost to join the conversation.