Extracting meaningful insights from diverse global datasets can be challenging and time-consuming.
While people and organizations have access to data, many lack the skills or time to analyze it effectively.
Transforming raw data into actionable insights across varied domains like happiness, education, and social media remains complex.
Traditional data analysis often requires expert knowledge or significant time investment, creating barriers to accessibility.
Most users want clear, easy-to-understand insights without needing technical expertise.
They aim to analyze and explore data quickly and efficiently, leveraging simplified, visually engaging reports.
What it does
BrightSpire, Association Mining Insights, is a web-based tool that connects users to three distinct Tableau dashboards, each designed to provide clear and actionable insights across different domains.
This tool simplifies the exploration of global data trends through interactive dashboards focused on:
World Happiness Dashboard: Visualizes global happiness factors like generosity, freedom, and health, uncovering their relationships across countries.
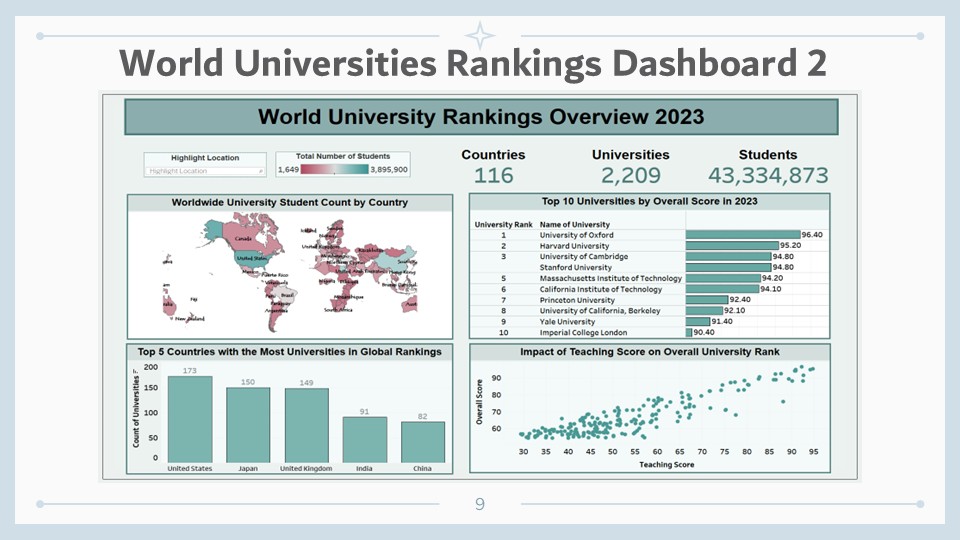
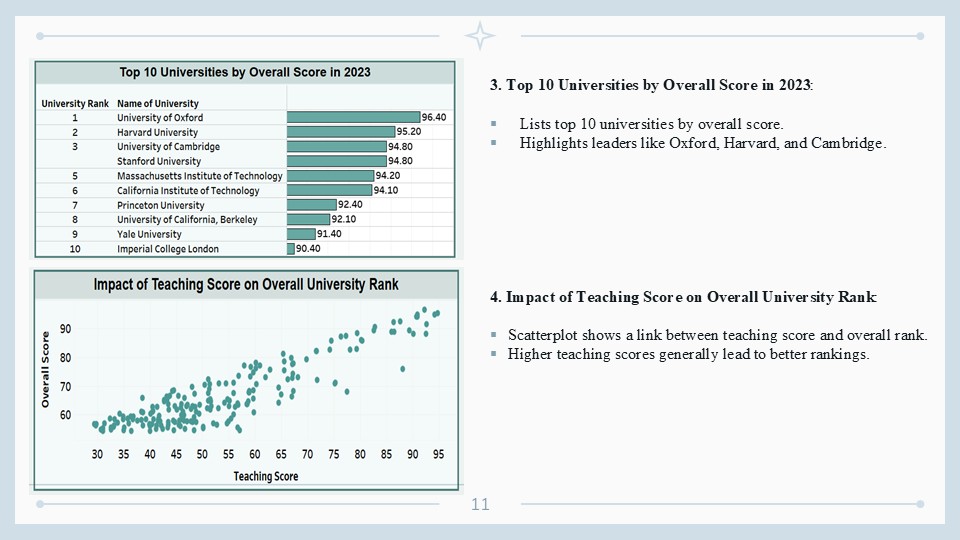
World University Rankings Dashboard: Analyzes university data to reveal trends in student populations, global rankings, and factors affecting educational quality.
Social Media Usage and Emotional Well-Being Dashboard: Explores the link between social media usage behaviors and emotional states, offering insights into the impact of social media on well-being.
How we built it
Platform and Tools:Leveraged Tableau for creating dashboards and applied association rule mining techniques to identify patterns. Additionally, we used Orange data mining software to design dynamic visuals and support interactive association mining, and Google Sites to create an accessible web platform.
Data Cleaning and Preparation: Processed large datasets from each domain to ensure accuracy and relevancy in visualizations.
Web Integration: Developed a user-friendly web interface on Google Sites that seamlessly links users to each dashboard, providing easy navigation and interaction.
Association Rule Mining Application: Applied association mining to uncover and interpret significant relationships within the datasets.
Challenges we ran into
Data Integration: Merging diverse datasets from different fields was complex and required extensive data cleaning.
Rule Interpretation: Ensuring that the association rules produced valuable insights without oversimplifying relationships.
Designing for Usability: Creating an engaging user experience for individuals unfamiliar with data analytics.
Accomplishments that we're proud of
Insightful Dashboards: Successfully developed user-friendly dashboards that bring out clear patterns in global happiness, education, and social media trends.
Effective Association Mining: Applied association mining techniques to create valuable, actionable insights.
Accessibility: Enabled a broader audience to access complex data insights without requiring a background in data analytics.
What we learned
Data Storytelling: Enhanced our ability to present data insights in a way that is engaging and easy to understand.
Technical Skills: Gained deeper knowledge in association mining and Tableau for data visualization.
Cross-Domain Analysis: Developed insights into how global happiness, educational rankings, and social media use interrelate, broadening our understanding of these areas.
What's next for BrightSpire
Expansion of Data Sources: Integrate more data sources to enrich insights across happiness, education, and social media.
Enhanced Interactivity: Add interactive elements to allow users to explore insights in more personalized ways.
Predictive Capabilities: Introduce predictive analytics to forecast trends based on historical data.


Log in or sign up for Devpost to join the conversation.