About the Project
Inspiration
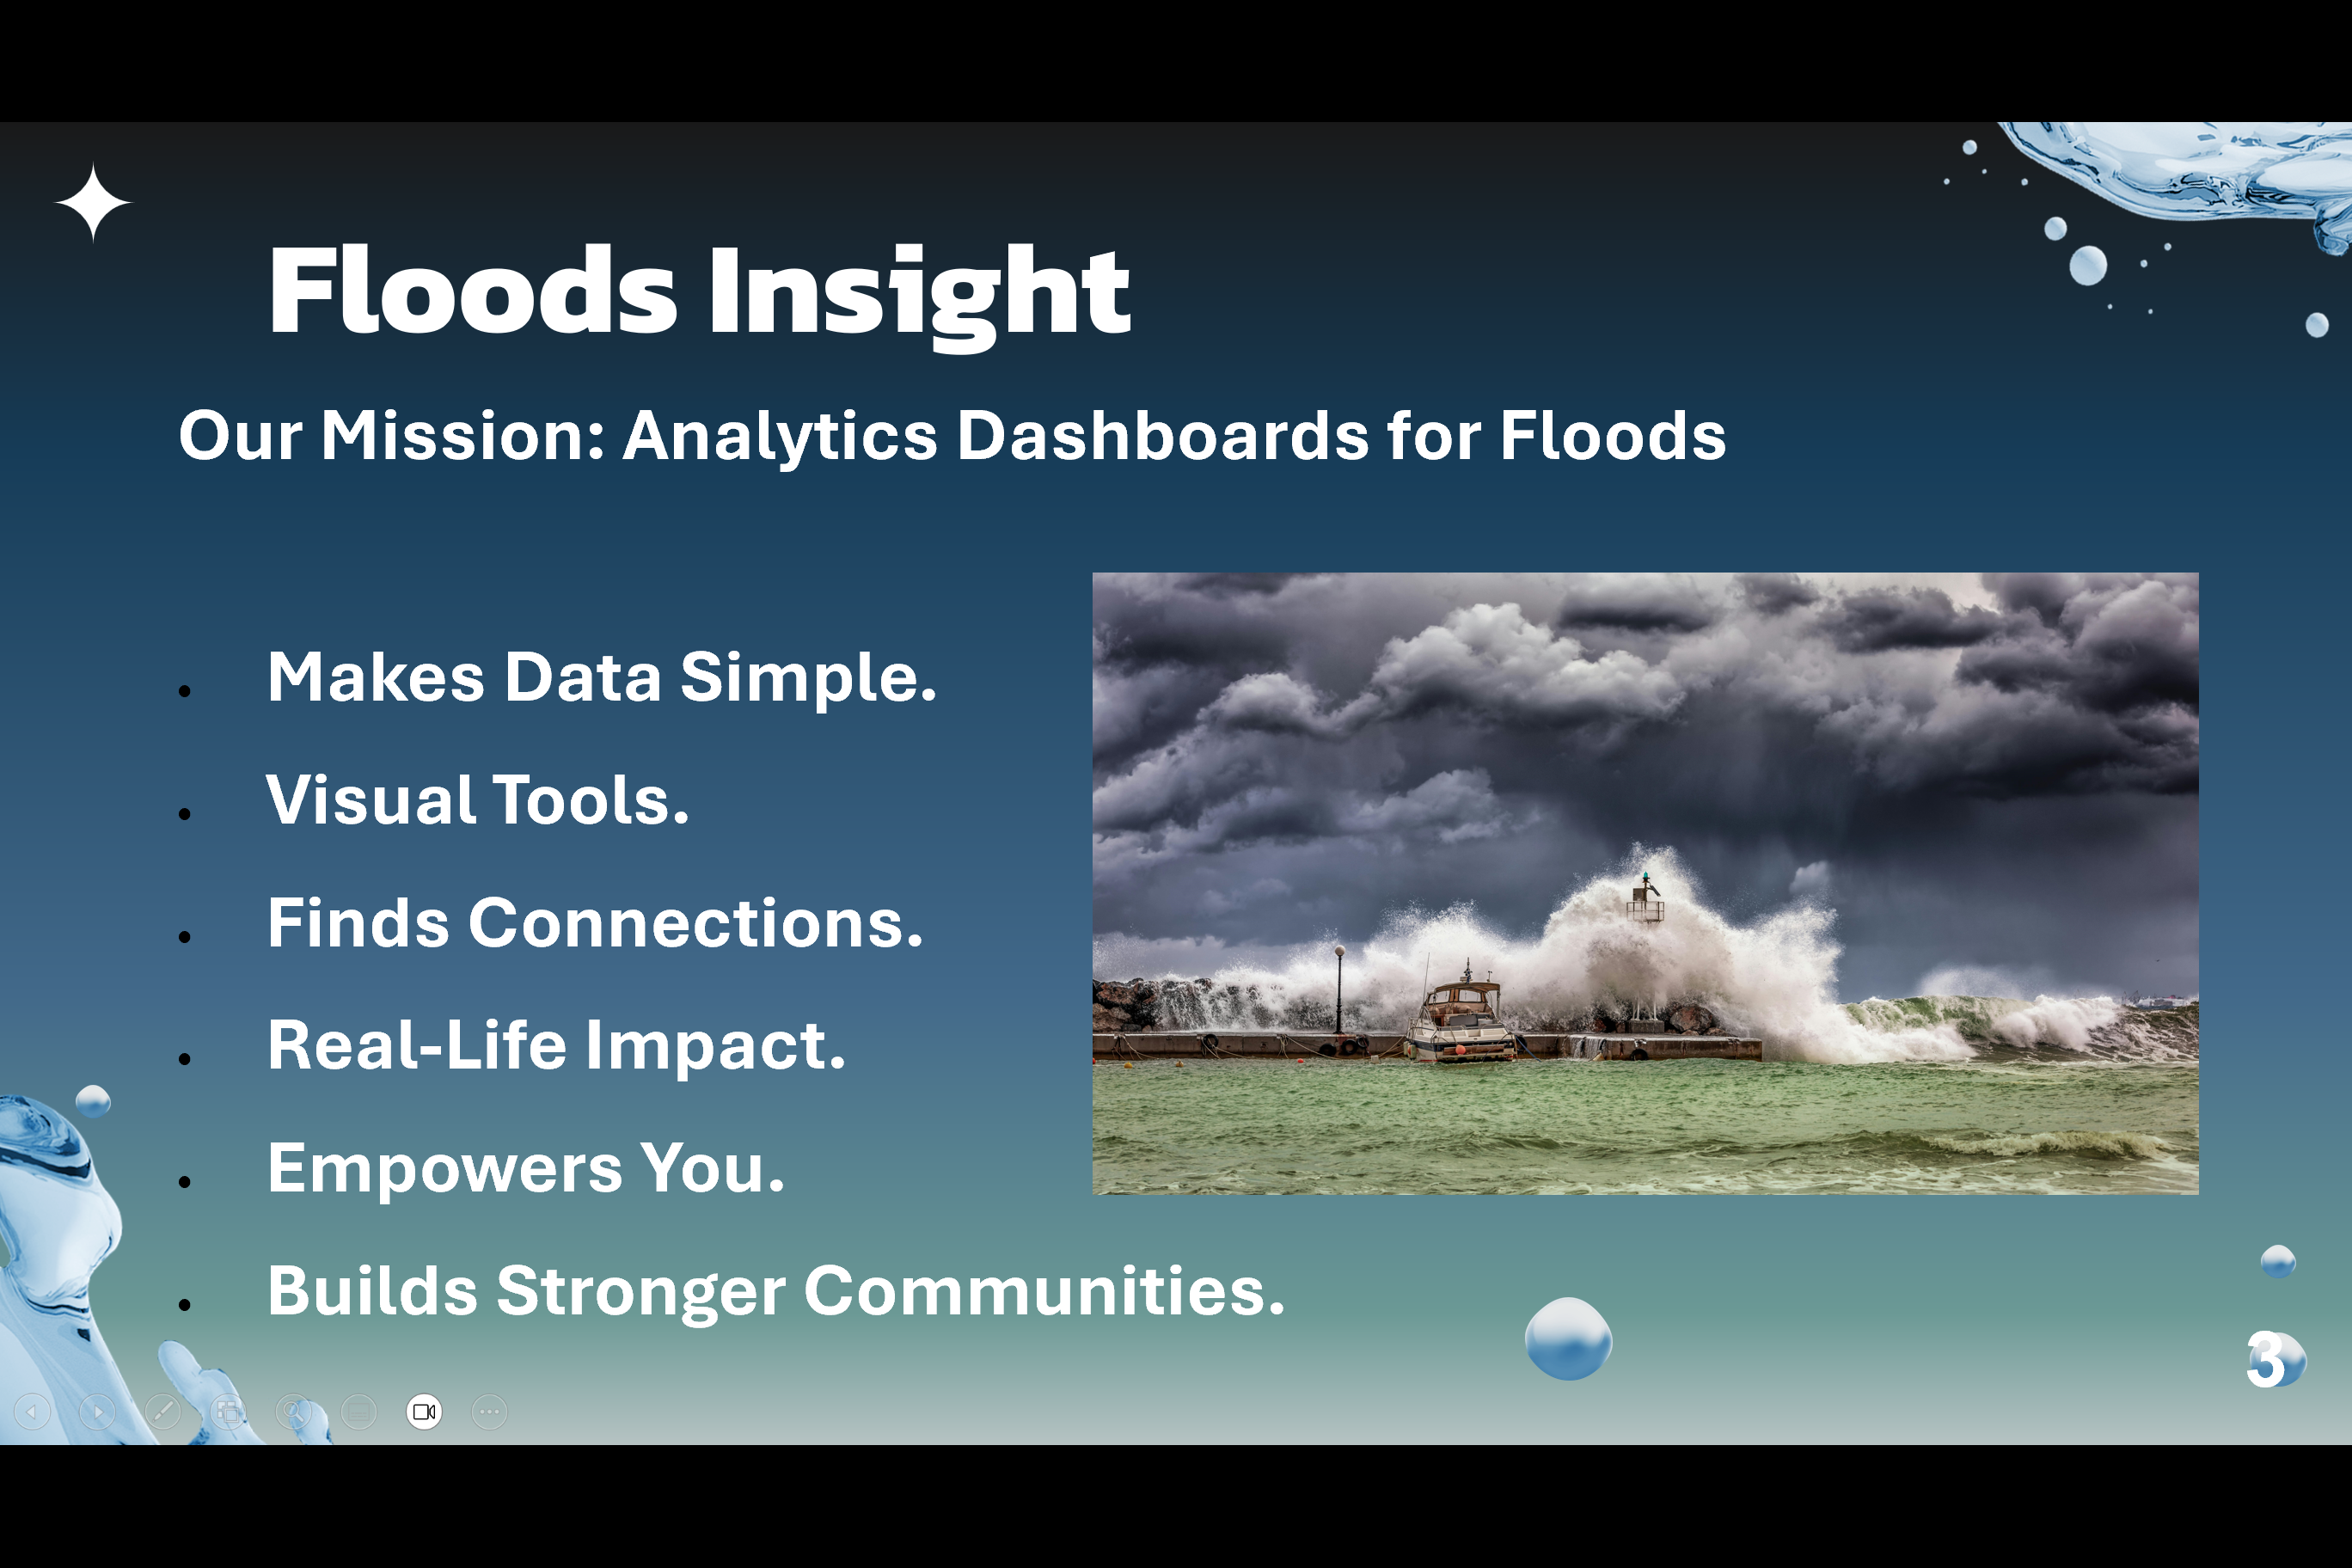
The severe impact of floods in Myanmar and other regions really opened our eyes to the urgent need for better disaster response solutions. We were motivated to create a platform that makes flood data analysis easier, helping communities understand their risks and improve their preparedness for such disasters.
What We Learned
This project taught us a lot, including:
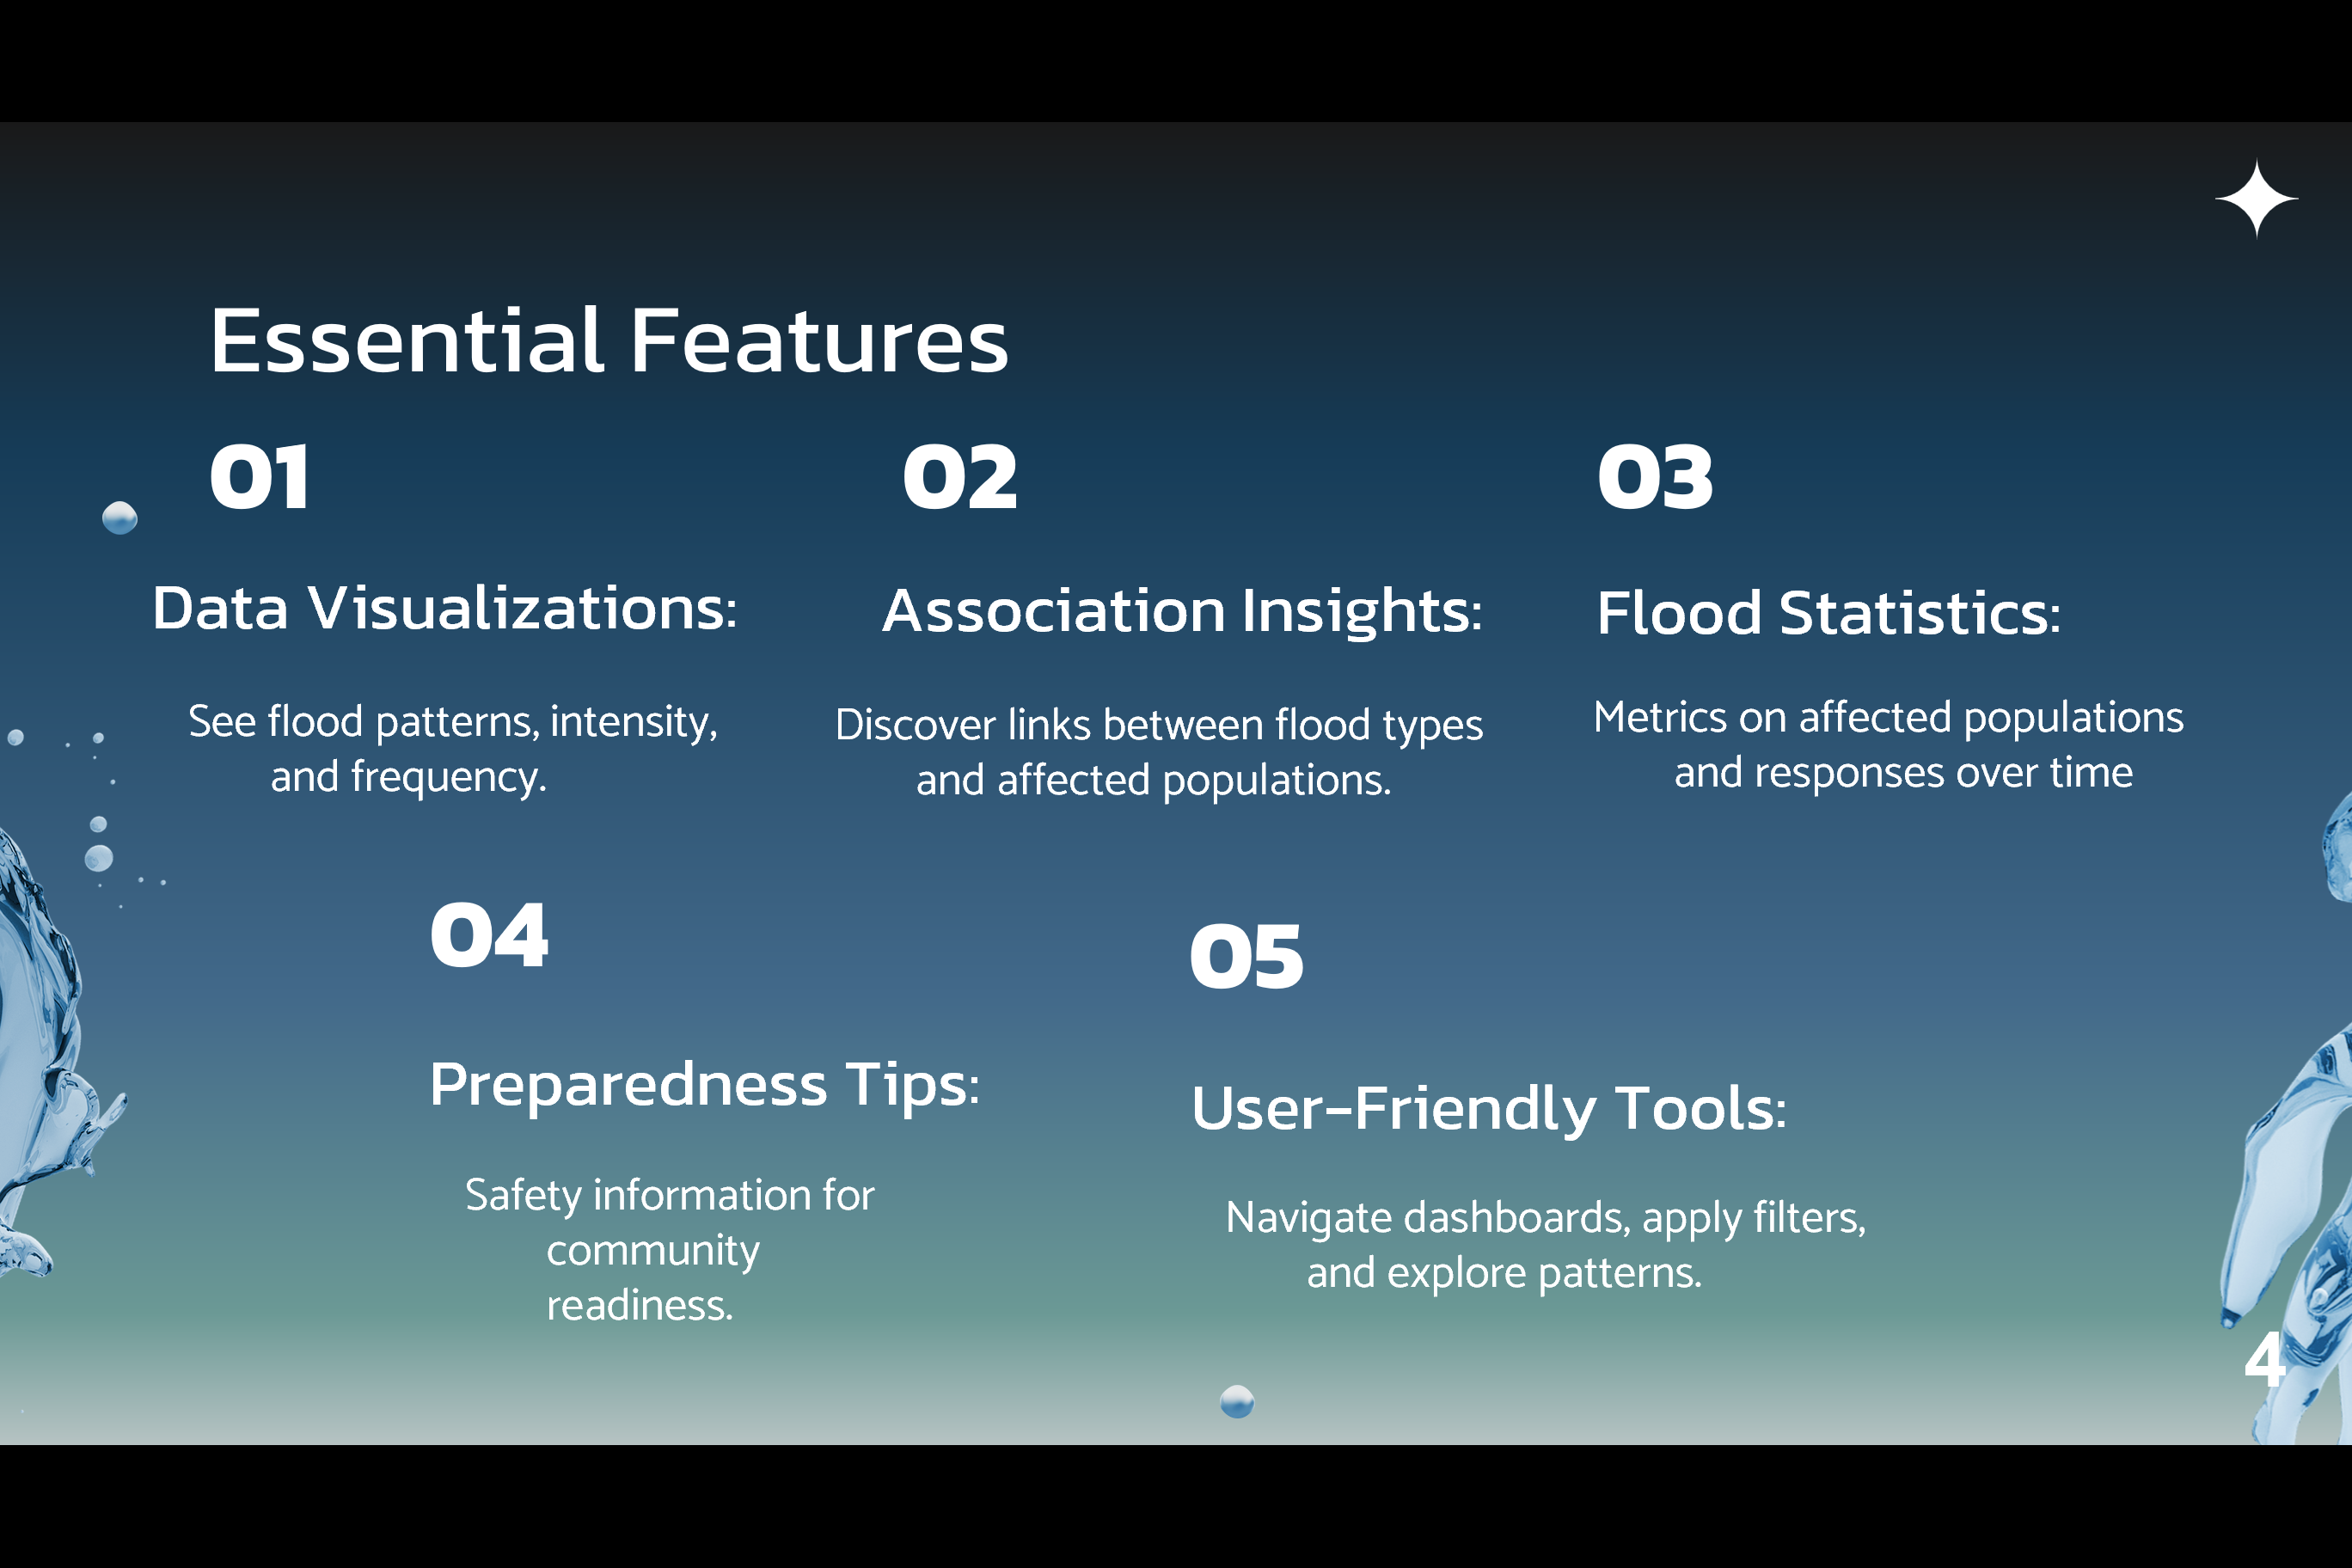
- Data Visualization: We learned how to present complex data in a clear and engaging way, making it easier for people to grasp important information.
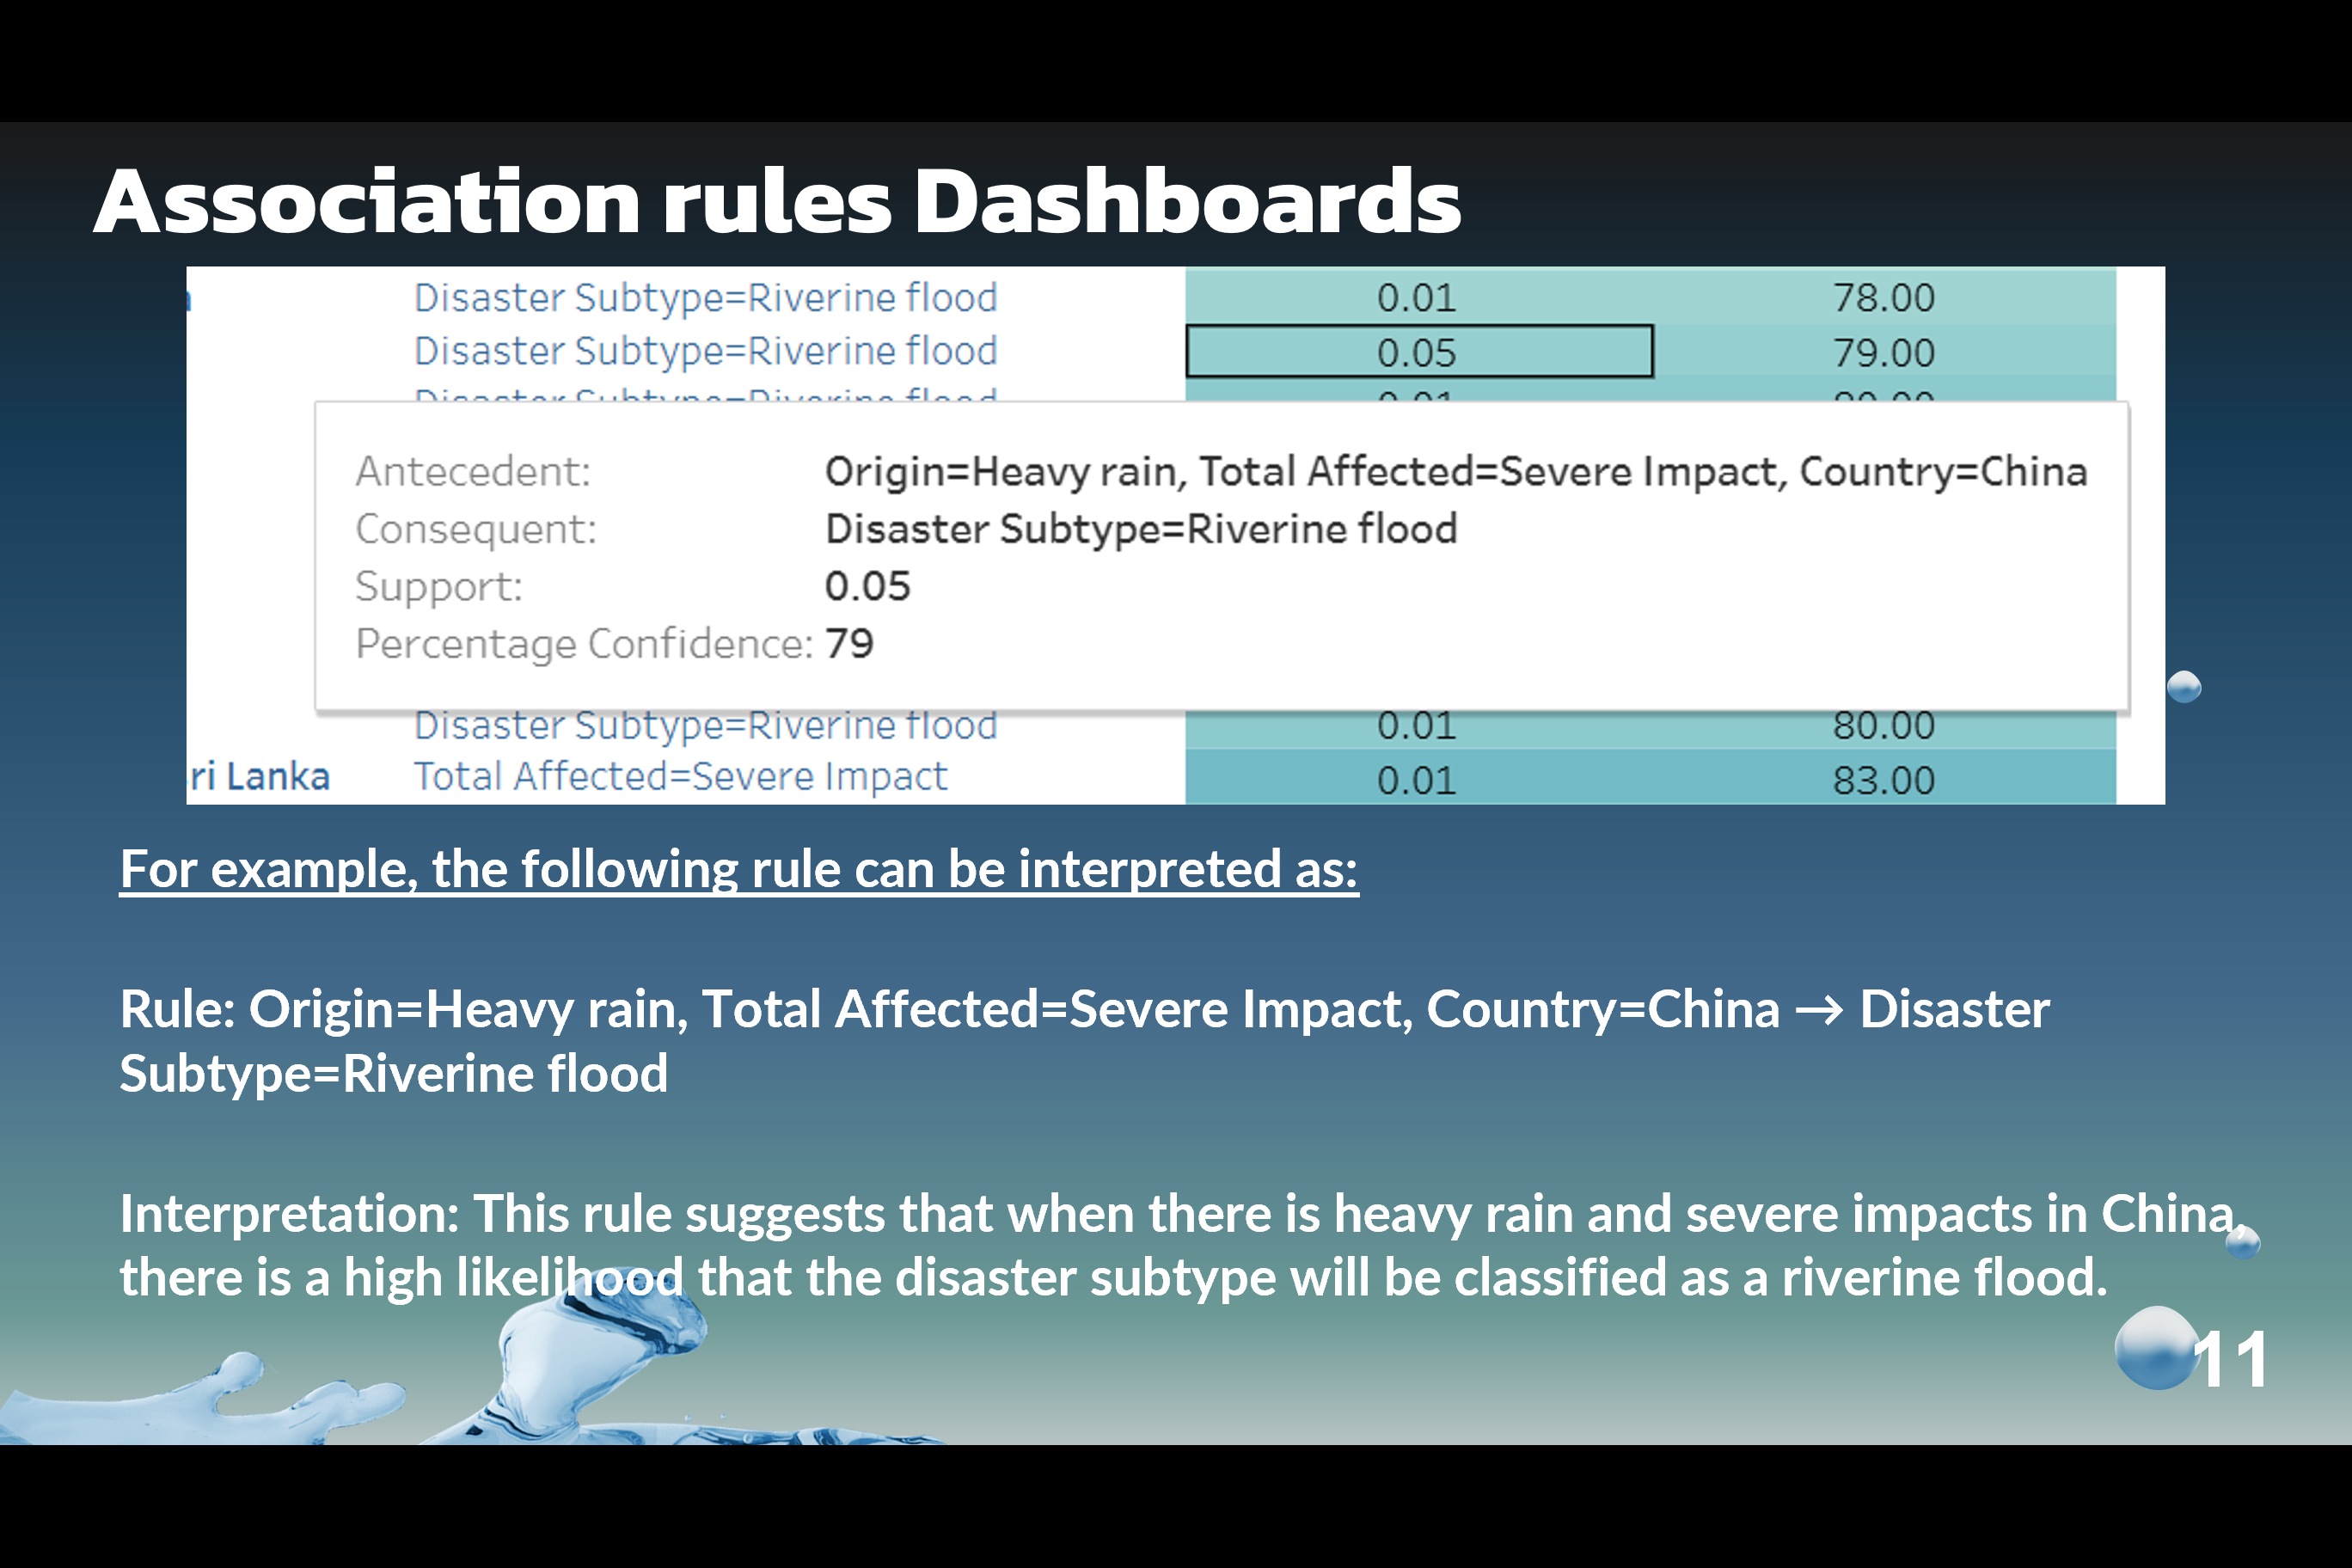
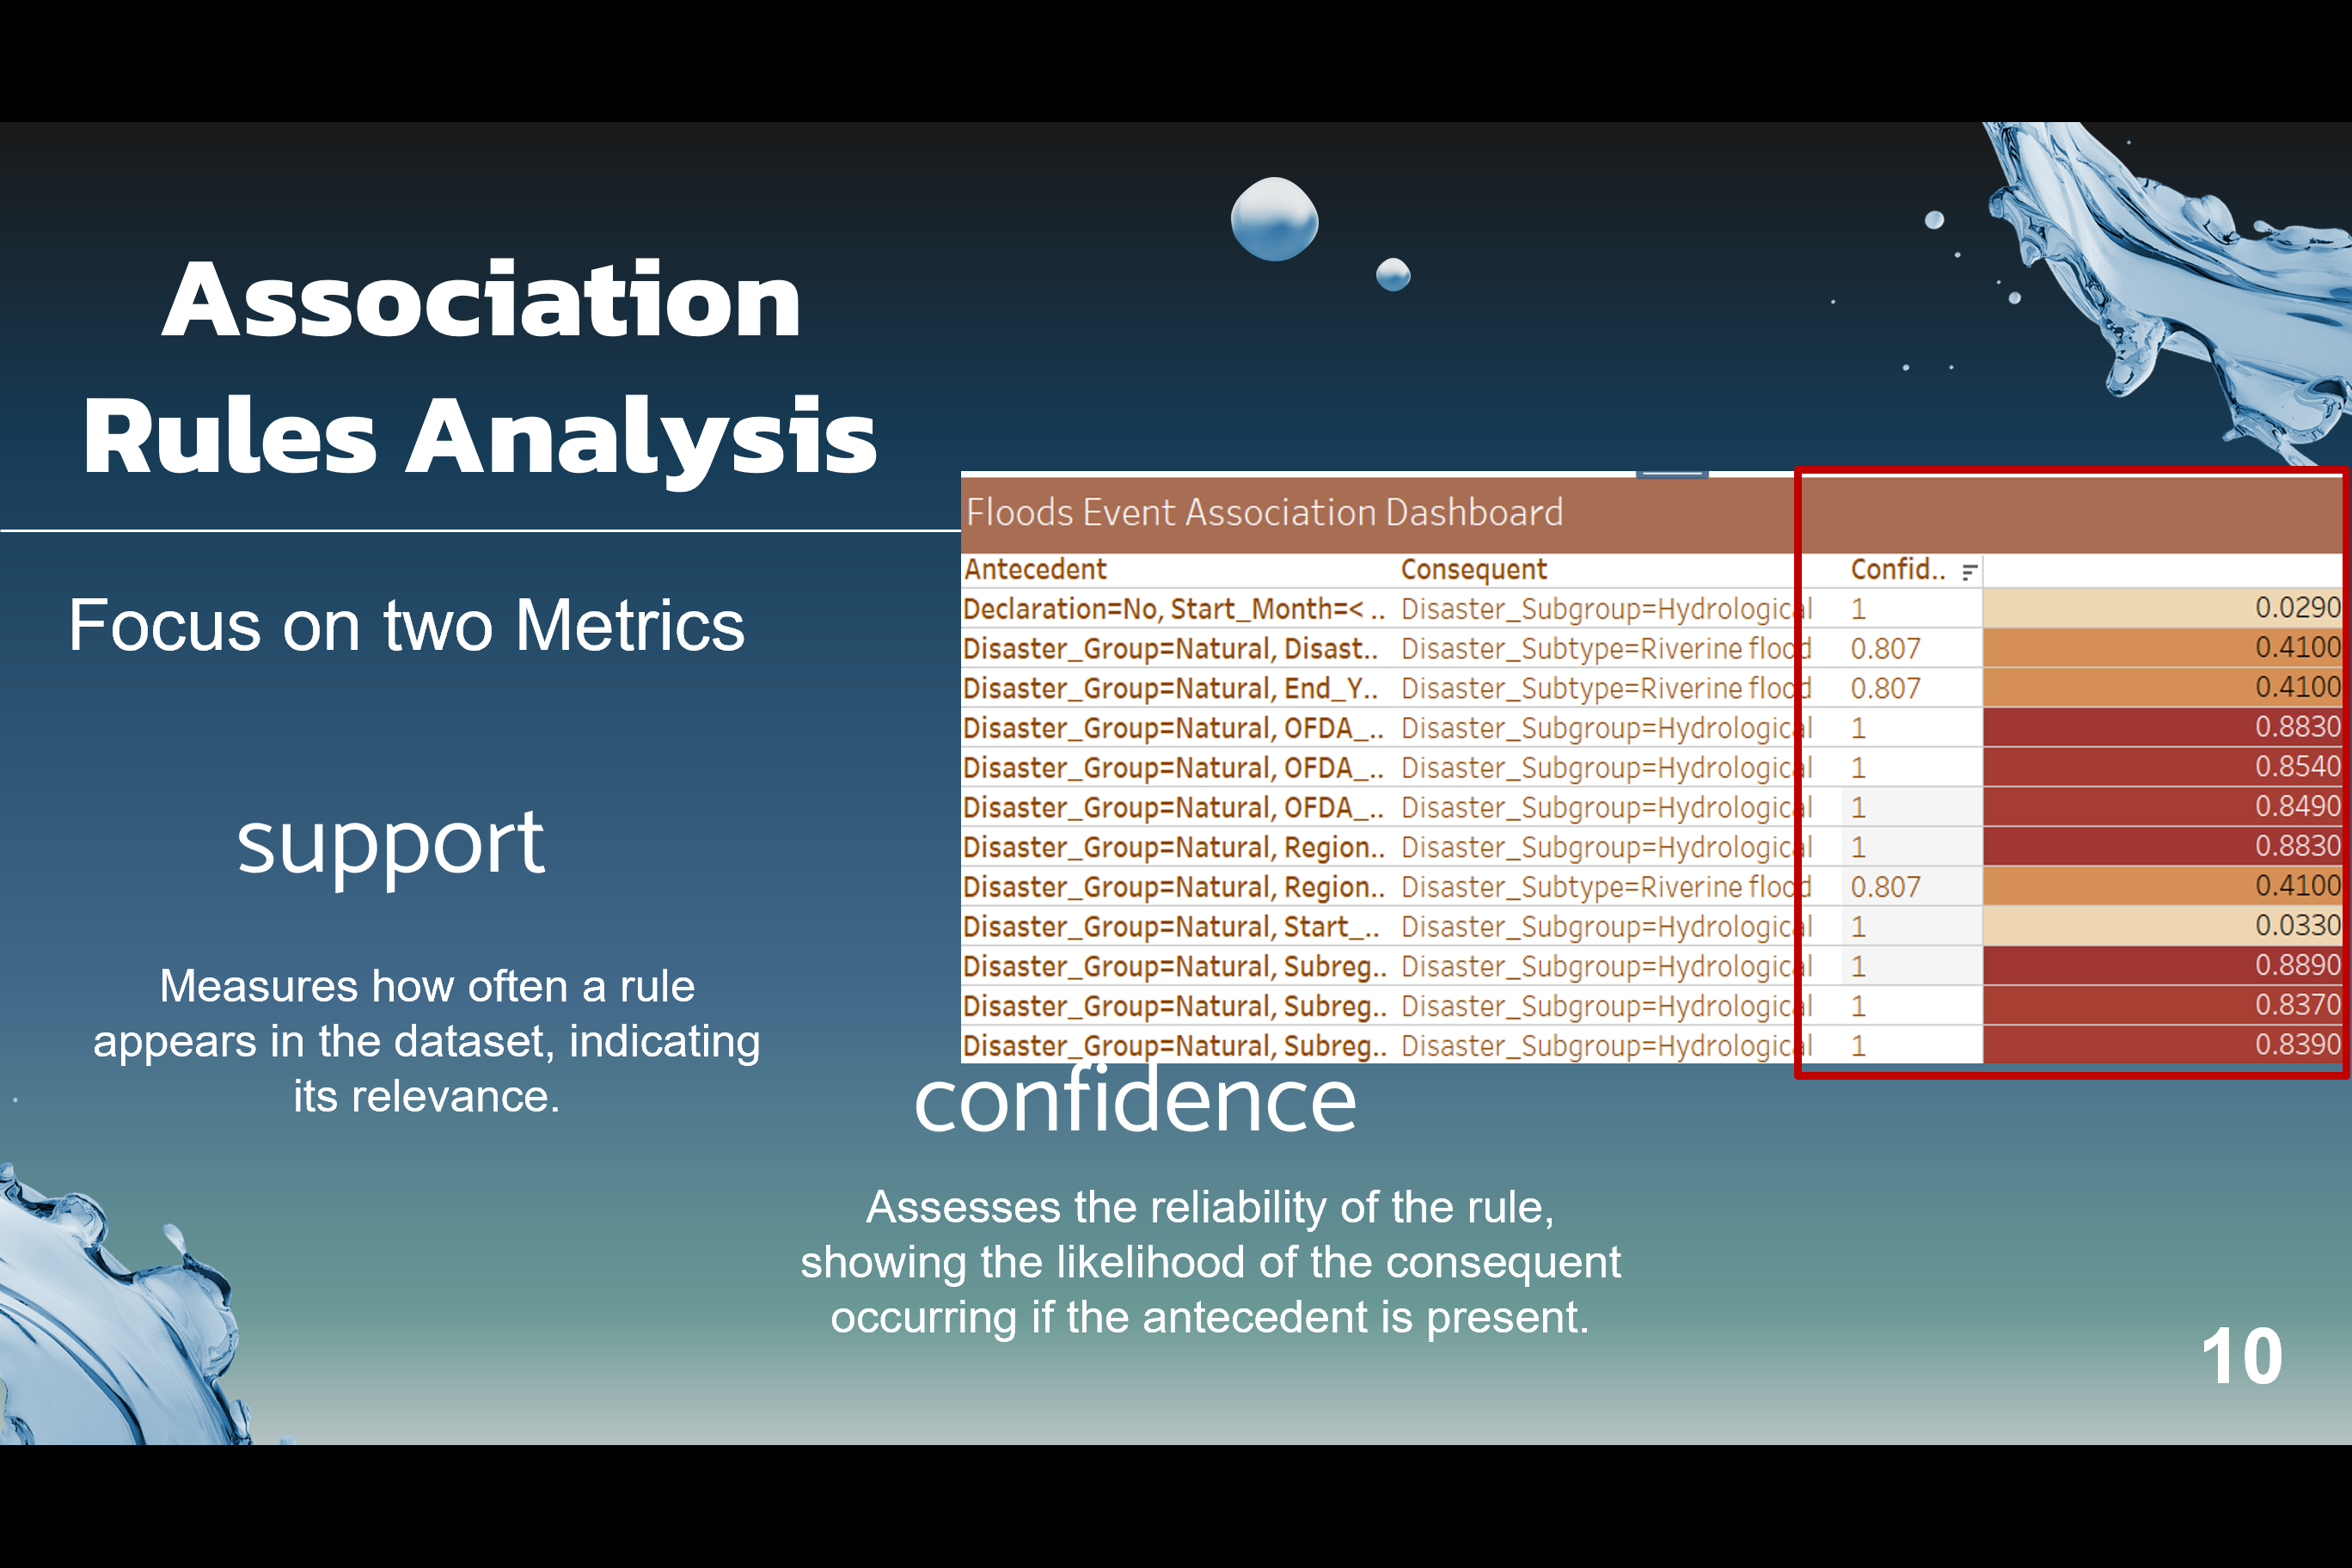
- Association Rule Mining: We discovered how to identify patterns and correlations in flood data, which can inform better disaster response strategies.
- User-Centered Design: We focused on creating an intuitive interface, ensuring that our platform is accessible to a wide range of users, from experts to everyday people.
How We Built It
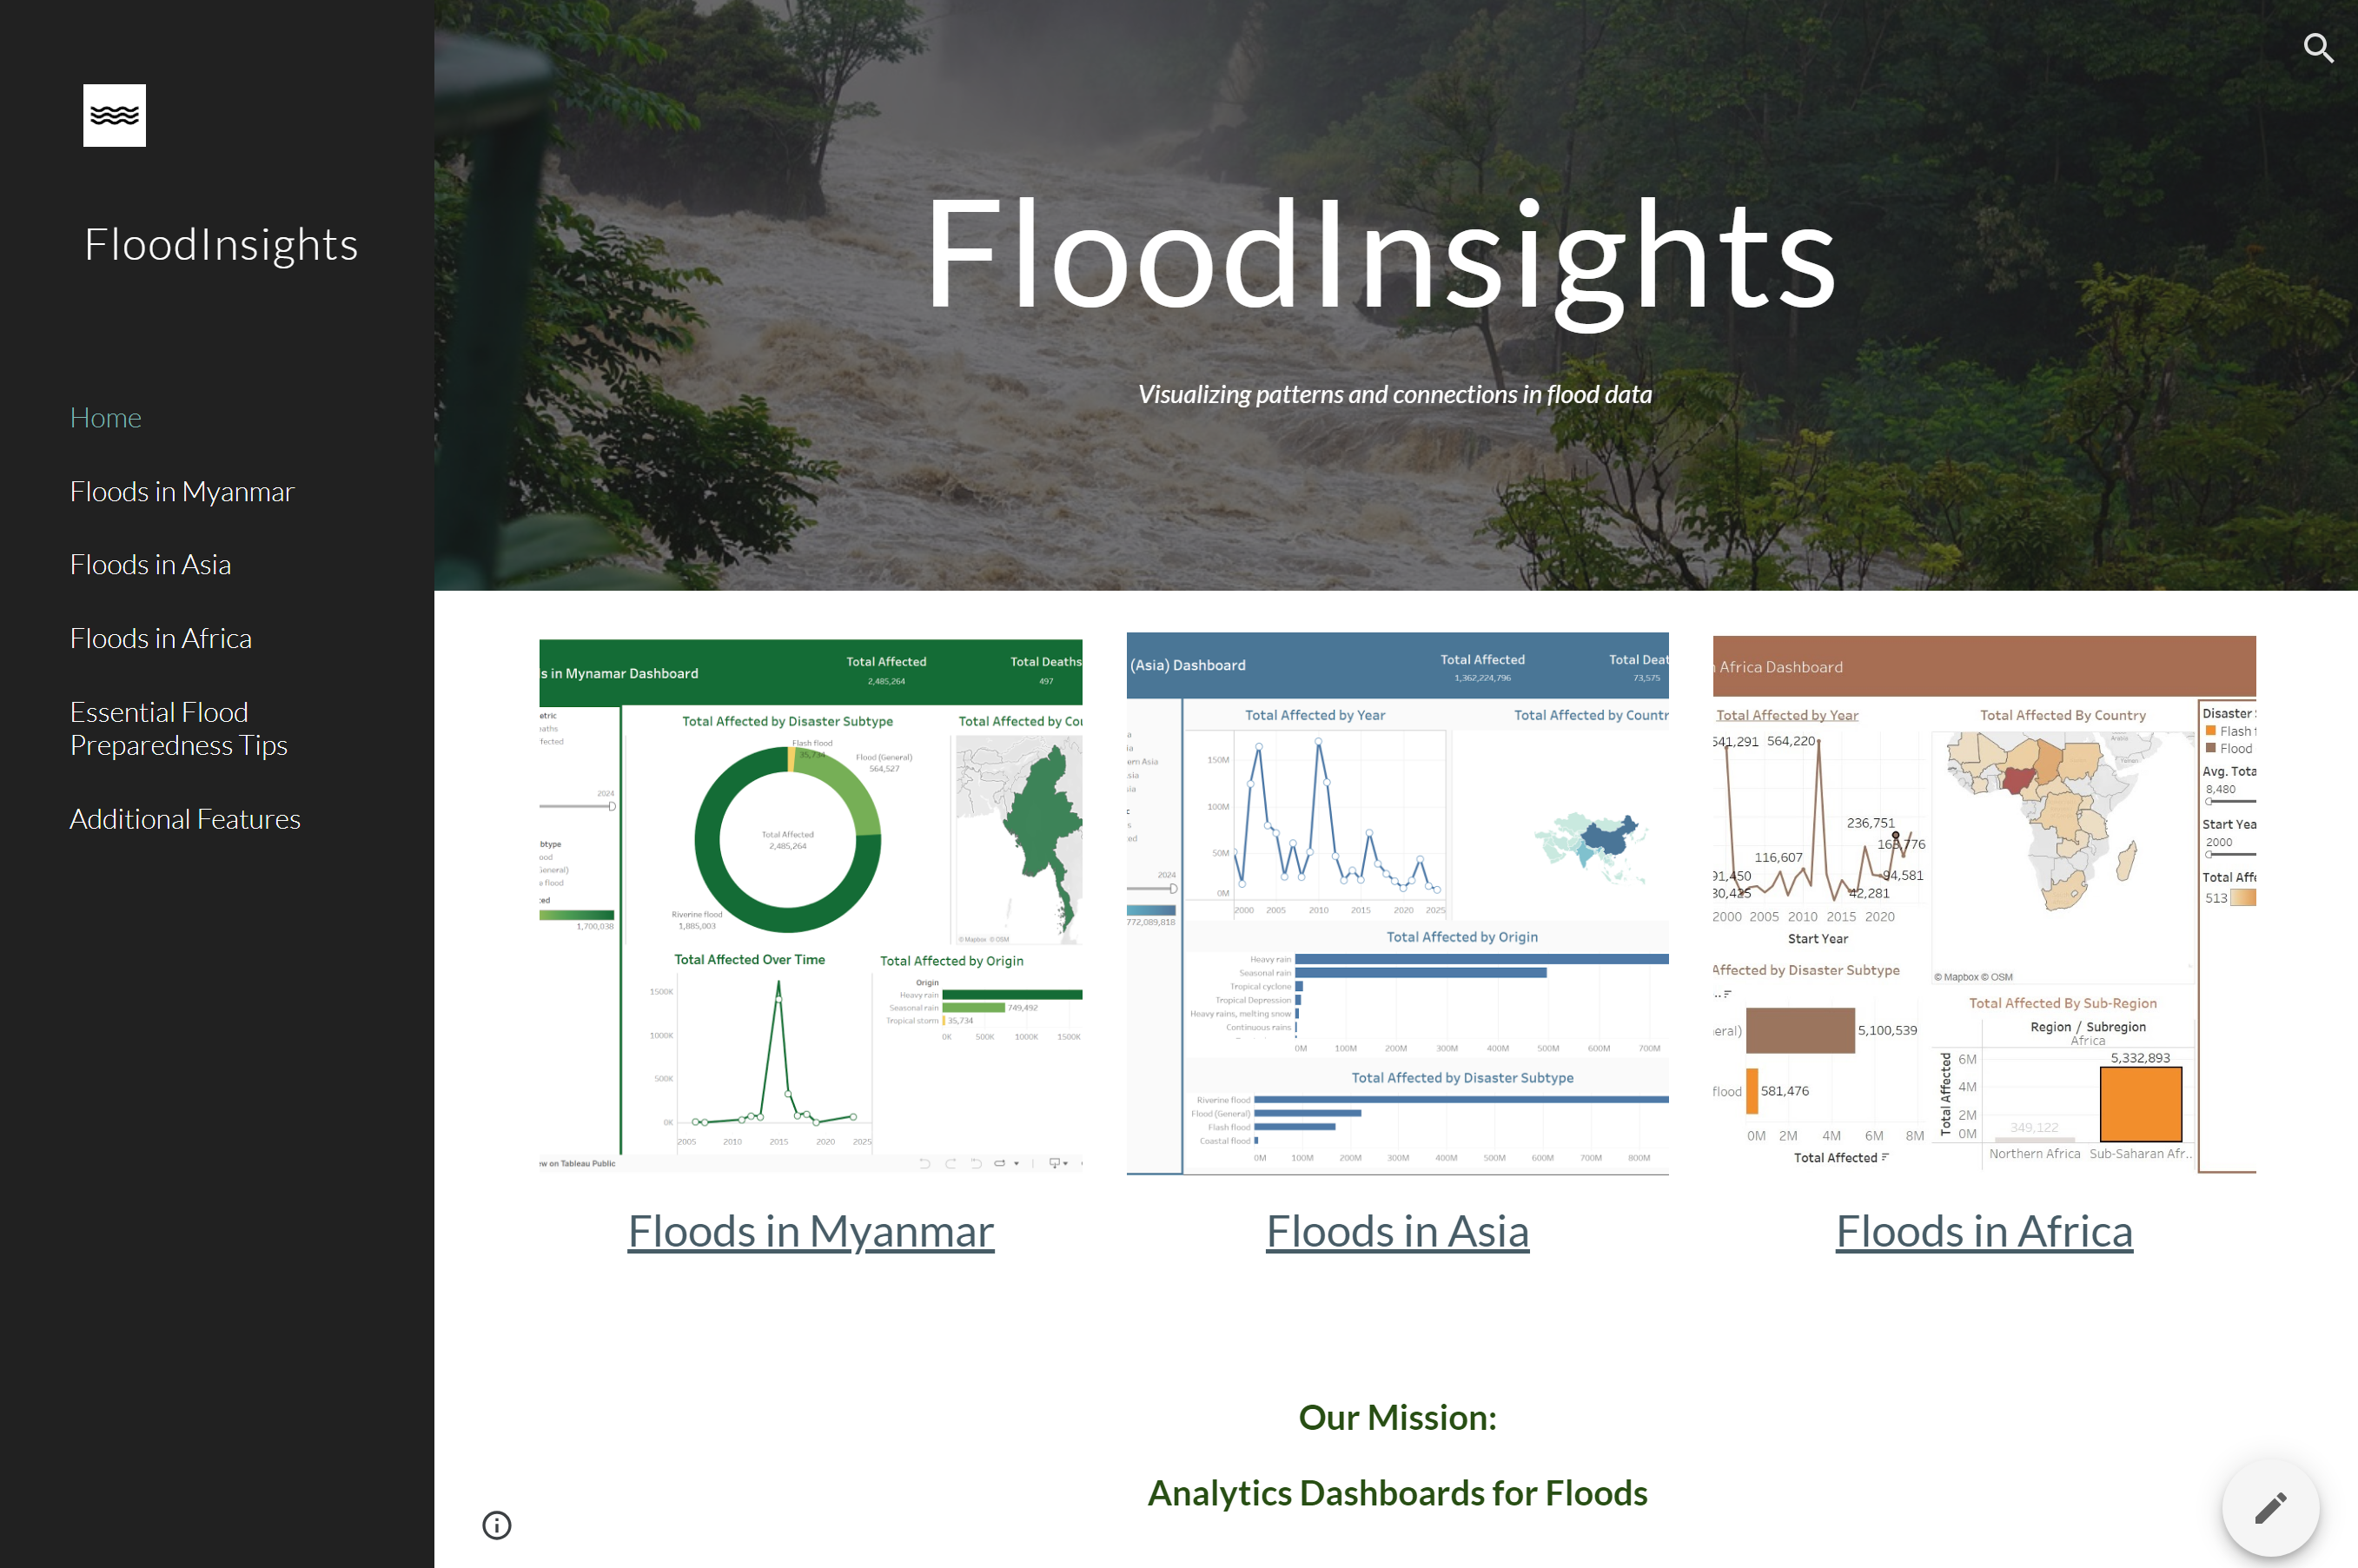
- Framework: We used Google Sites to create a platform that's easy to navigate.
- Visualization: For dynamic visuals, we turned to Tableau, showcasing flood patterns and the populations affected.
- Data Analysis: We employed Orange for association rule mining, helping us uncover meaningful relationships within the data.
- Data Source: Our data came from EM-DAT, ensuring we had accurate and comprehensive information on floods.
Challenges We Faced
- Data Complexity: Working with large datasets and pulling out valuable insights was quite a challenge.
- Visualization Integration: We had to ensure that different visualization tools worked well together while keeping everything user-friendly.
- User Engagement: We aimed to create an engaging experience that encourages users to explore the data, which required a lot of thought and testing.
Accomplishments That We’re Proud Of
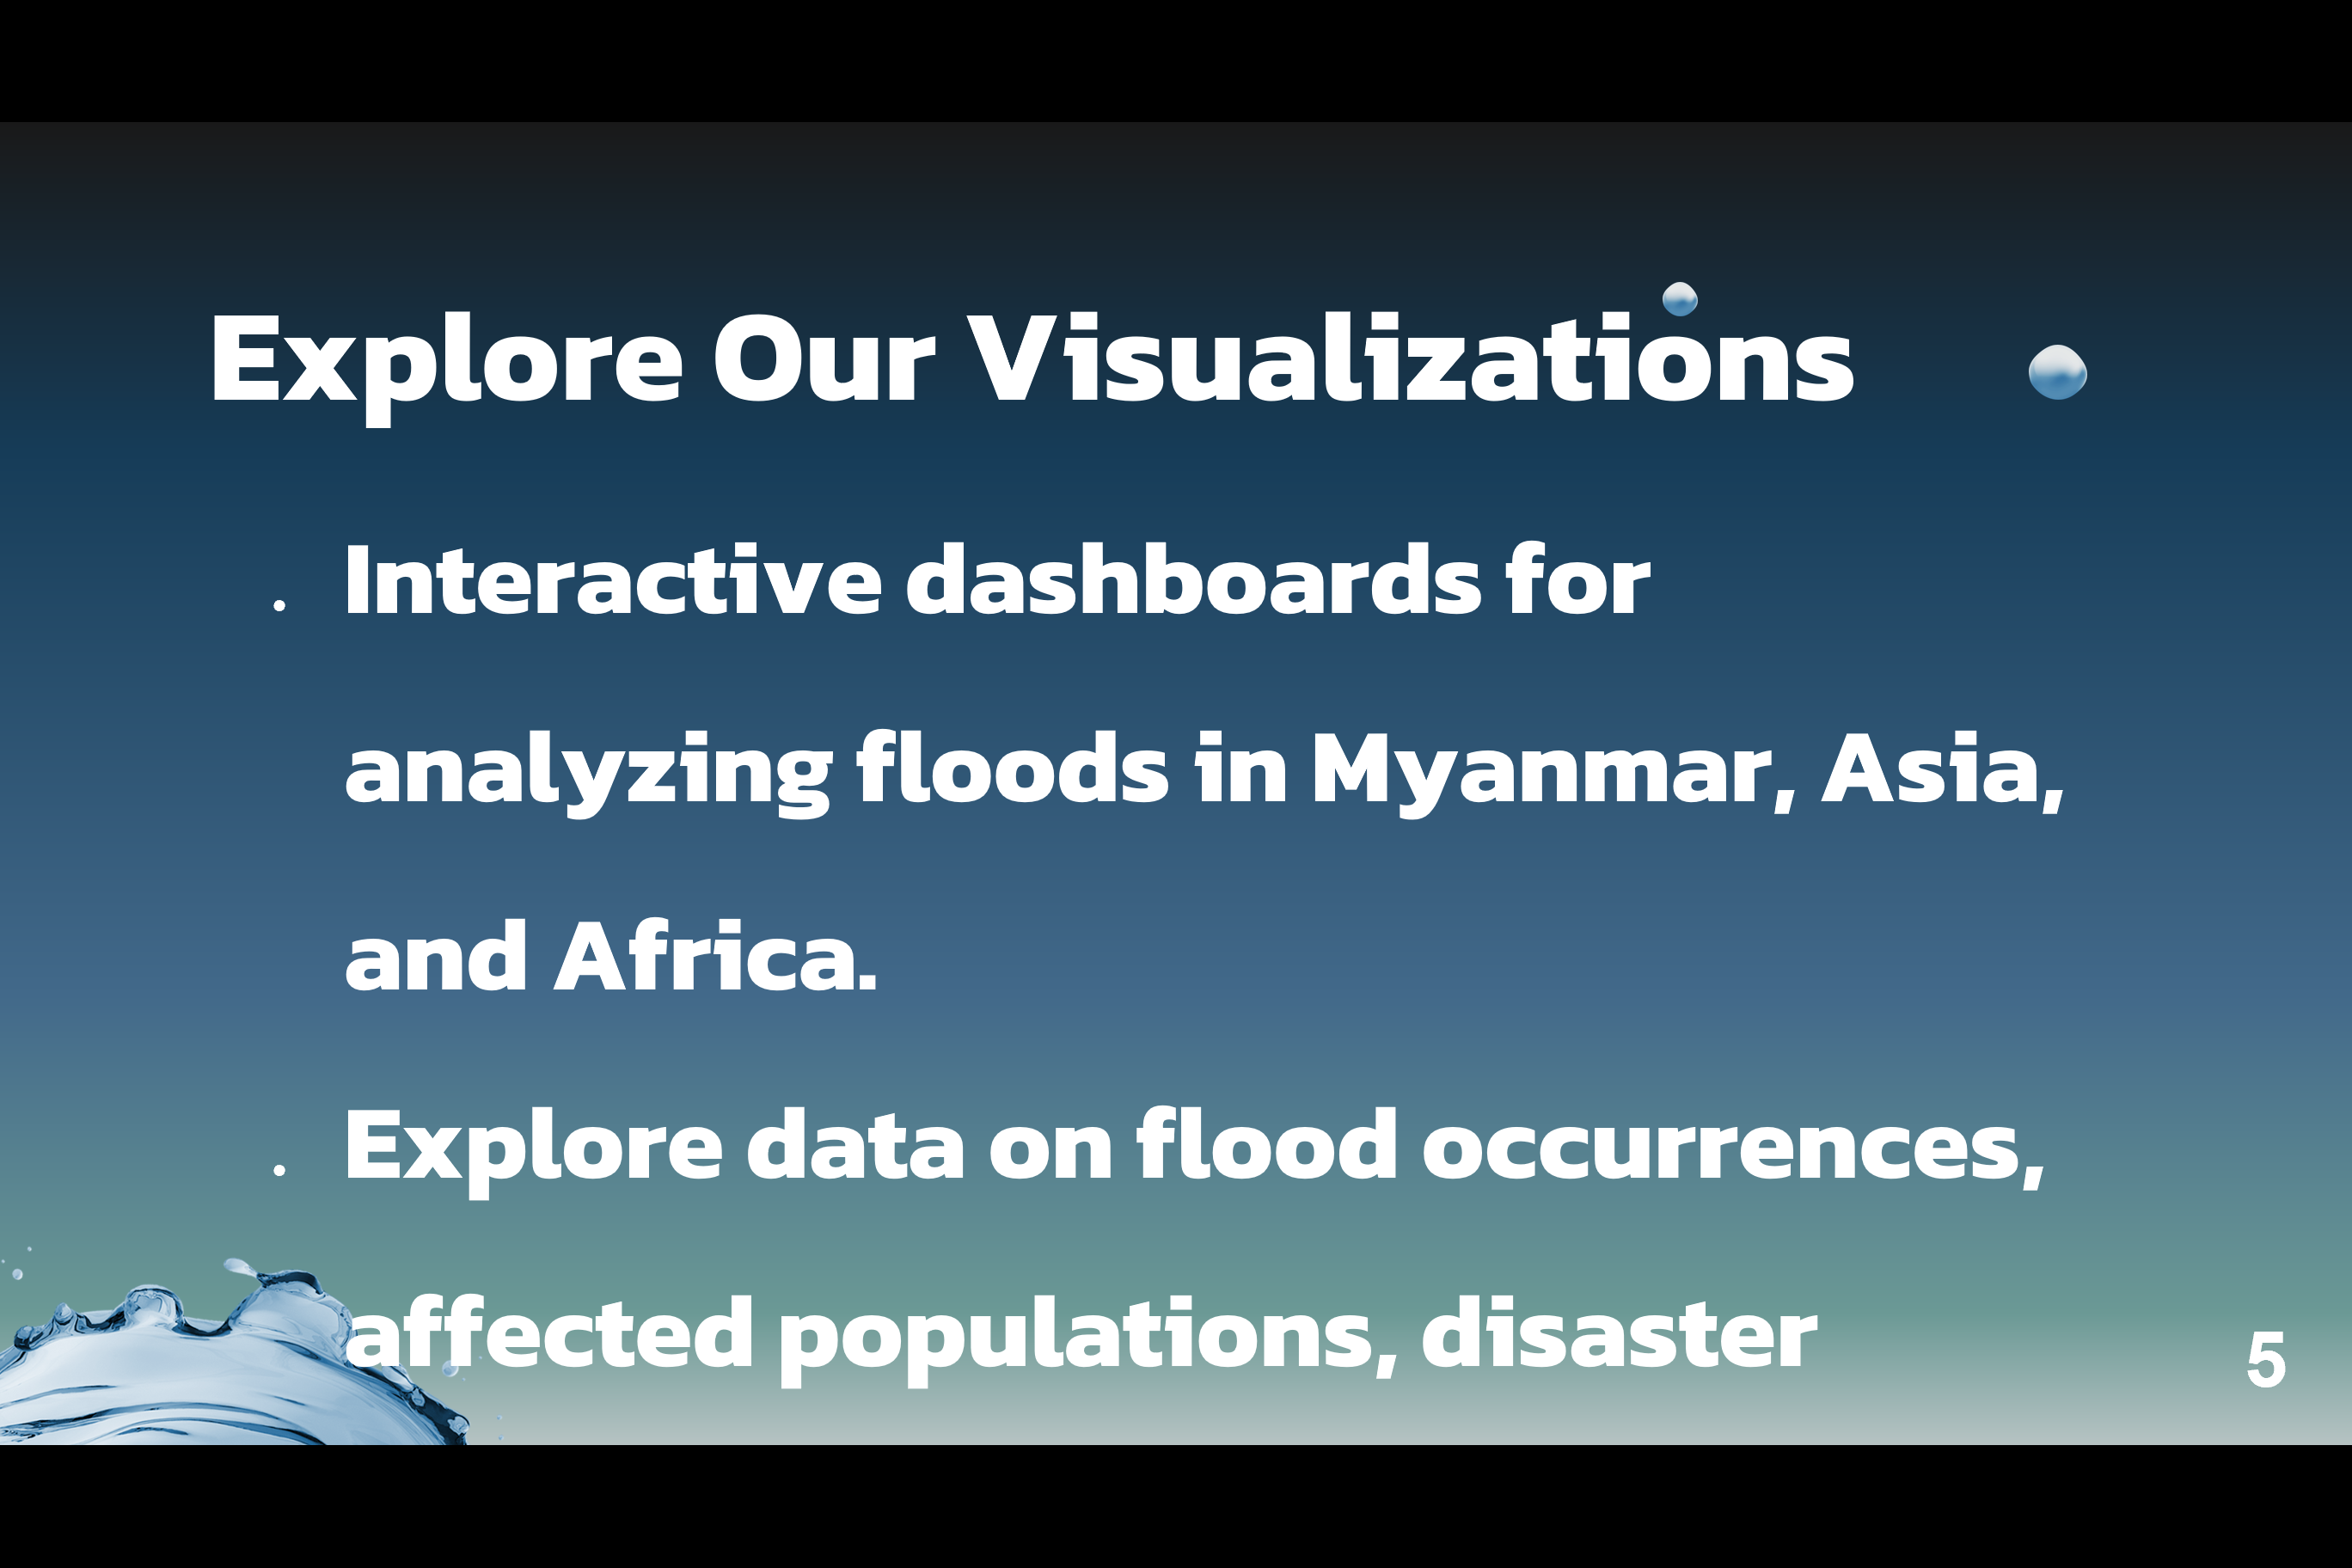
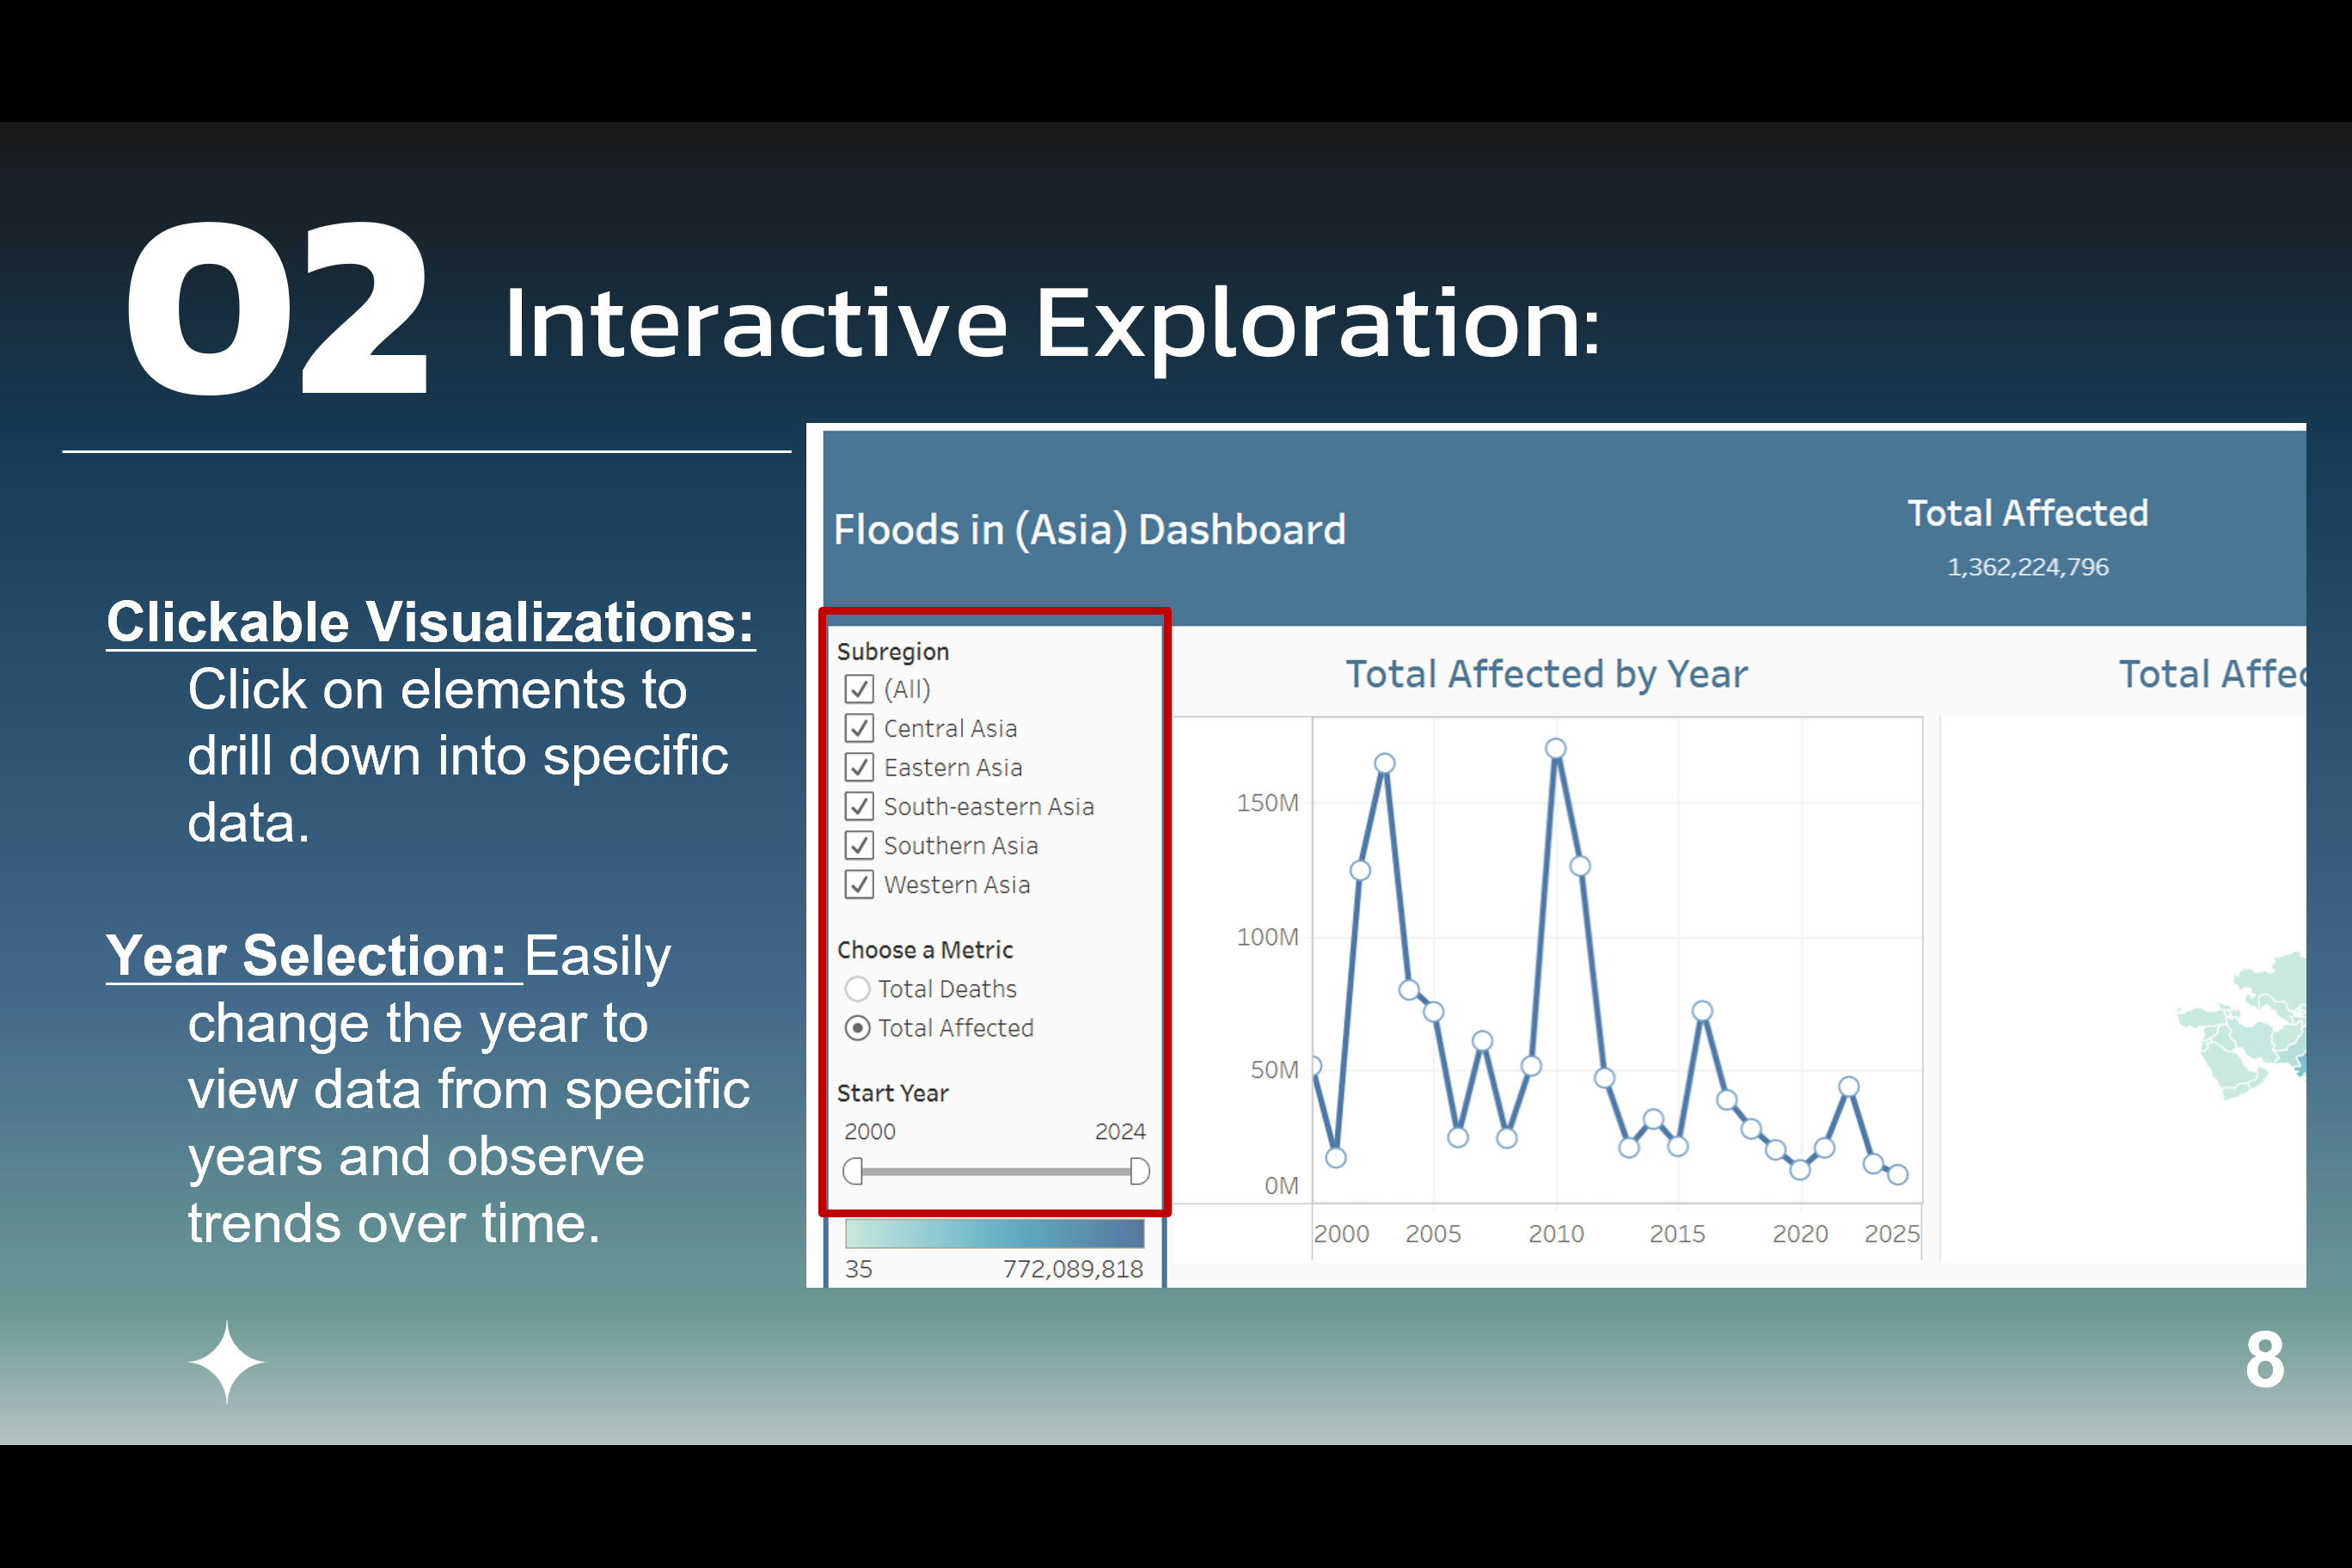
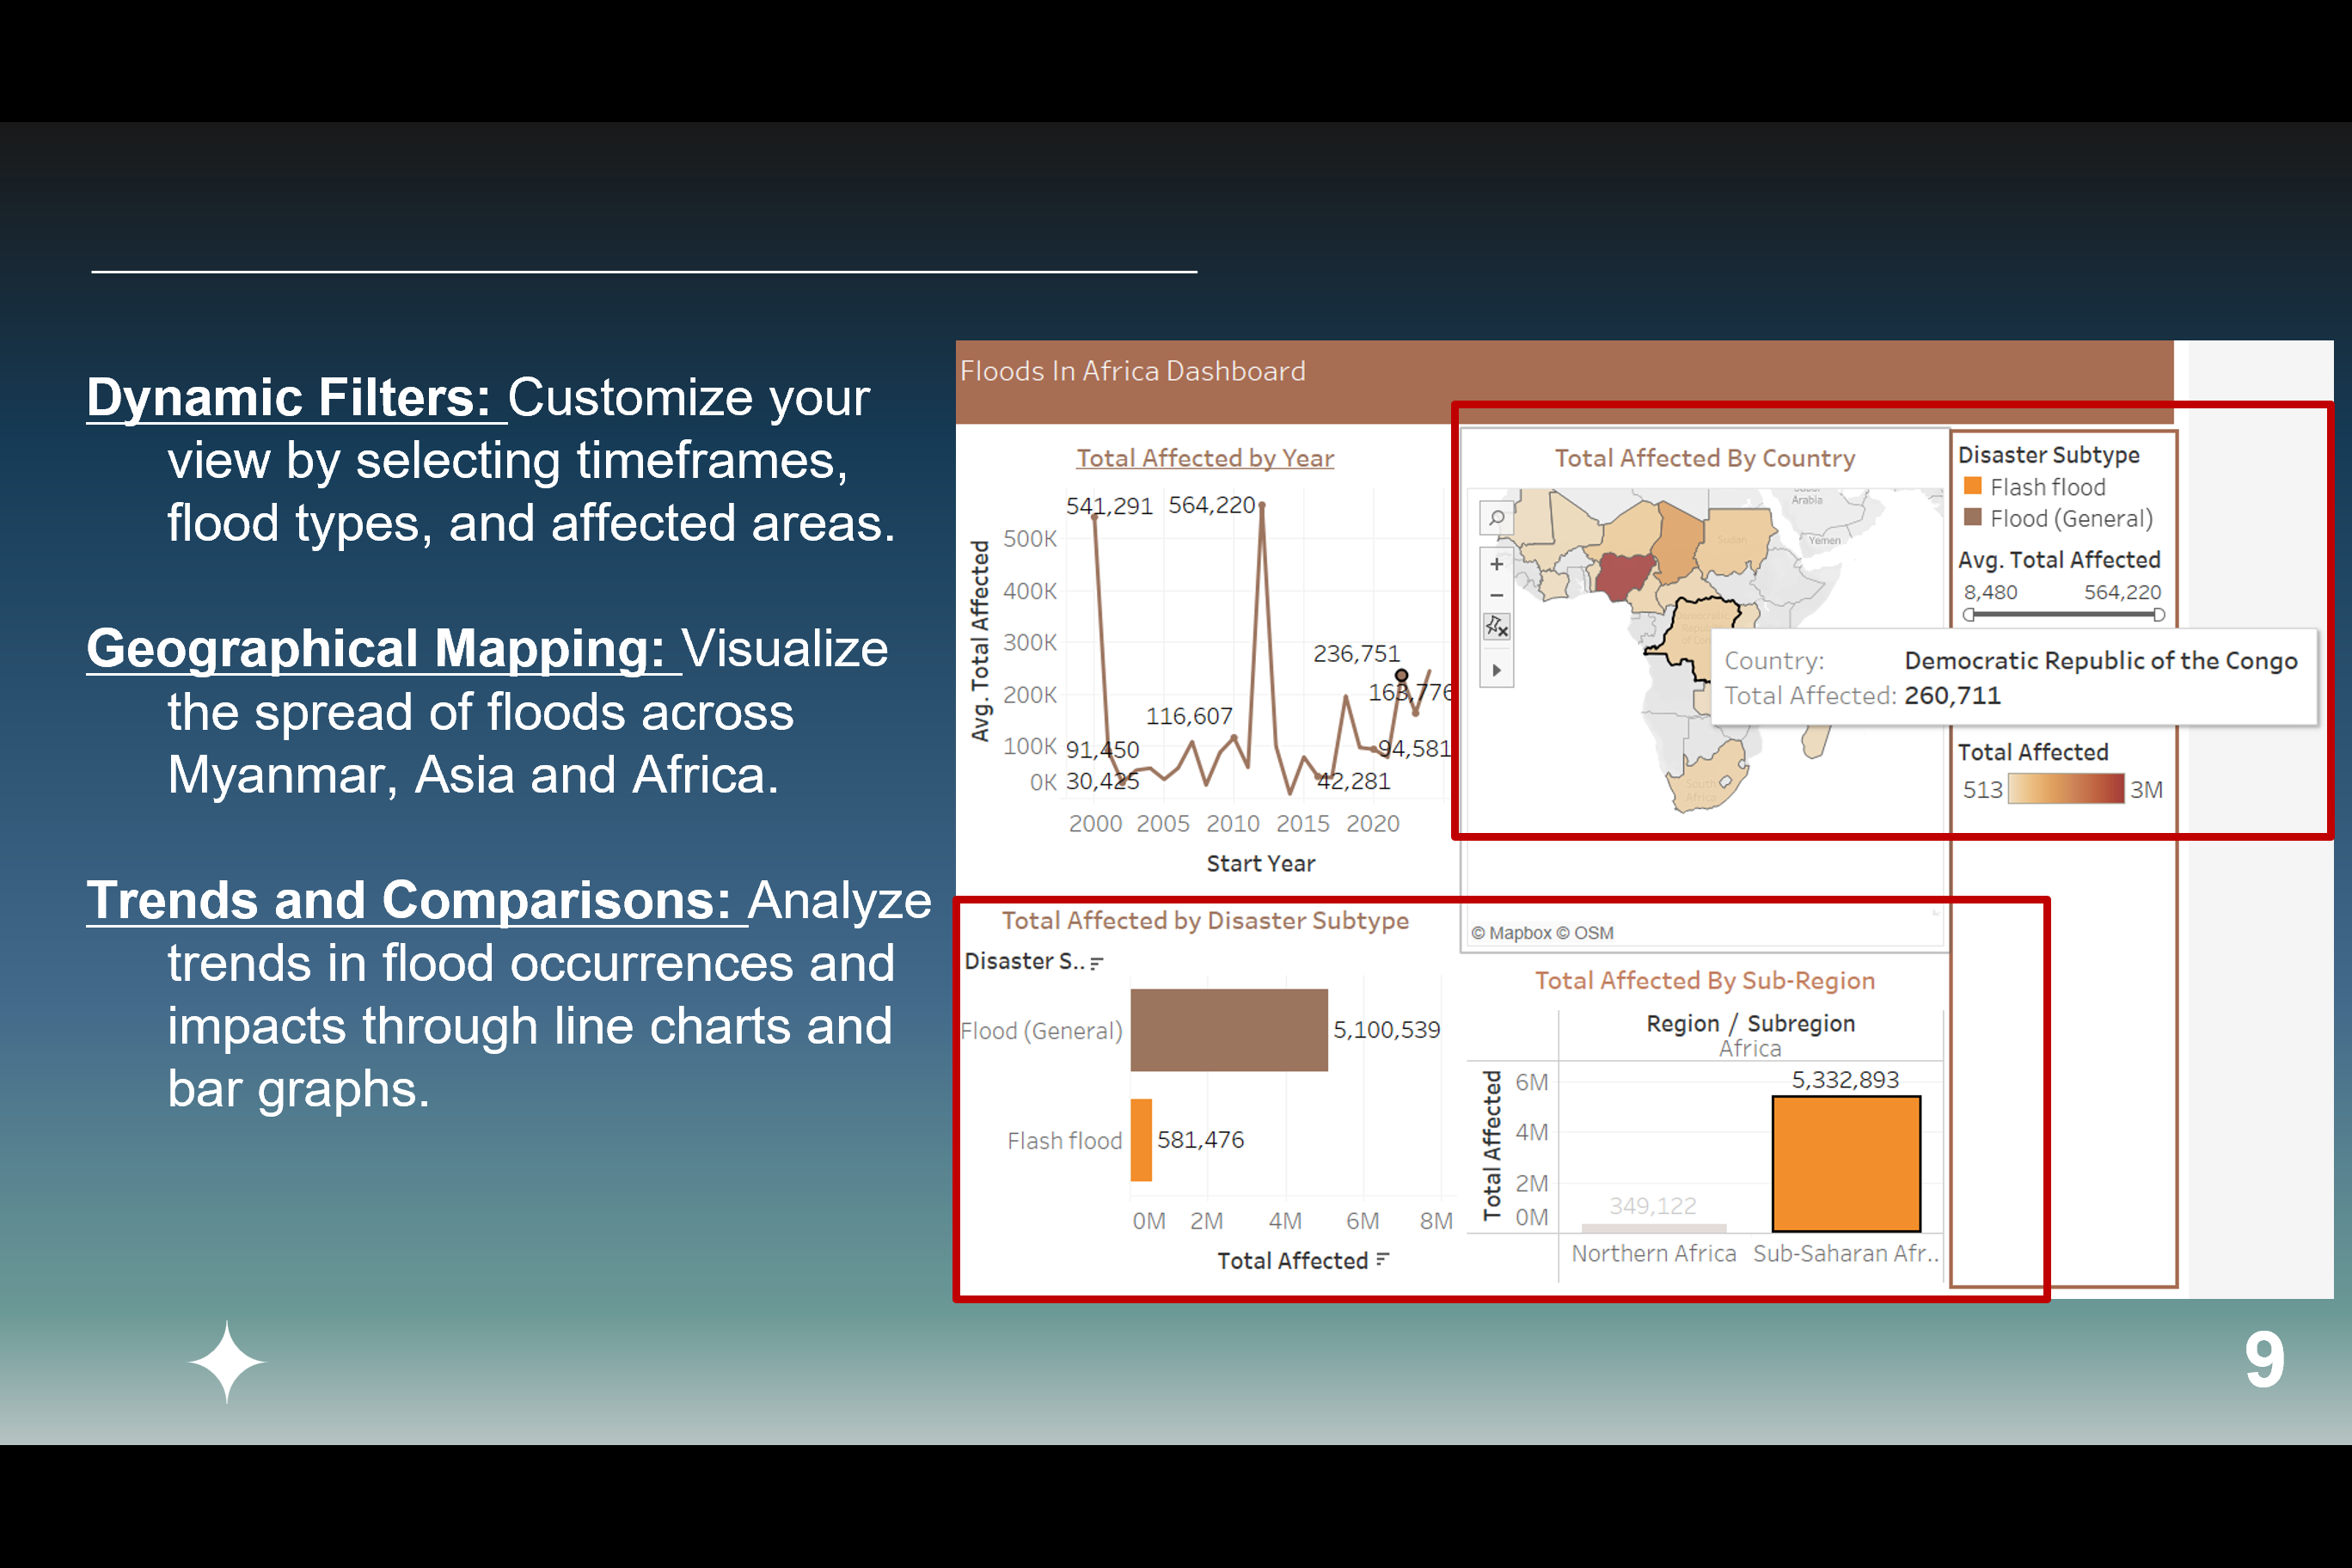
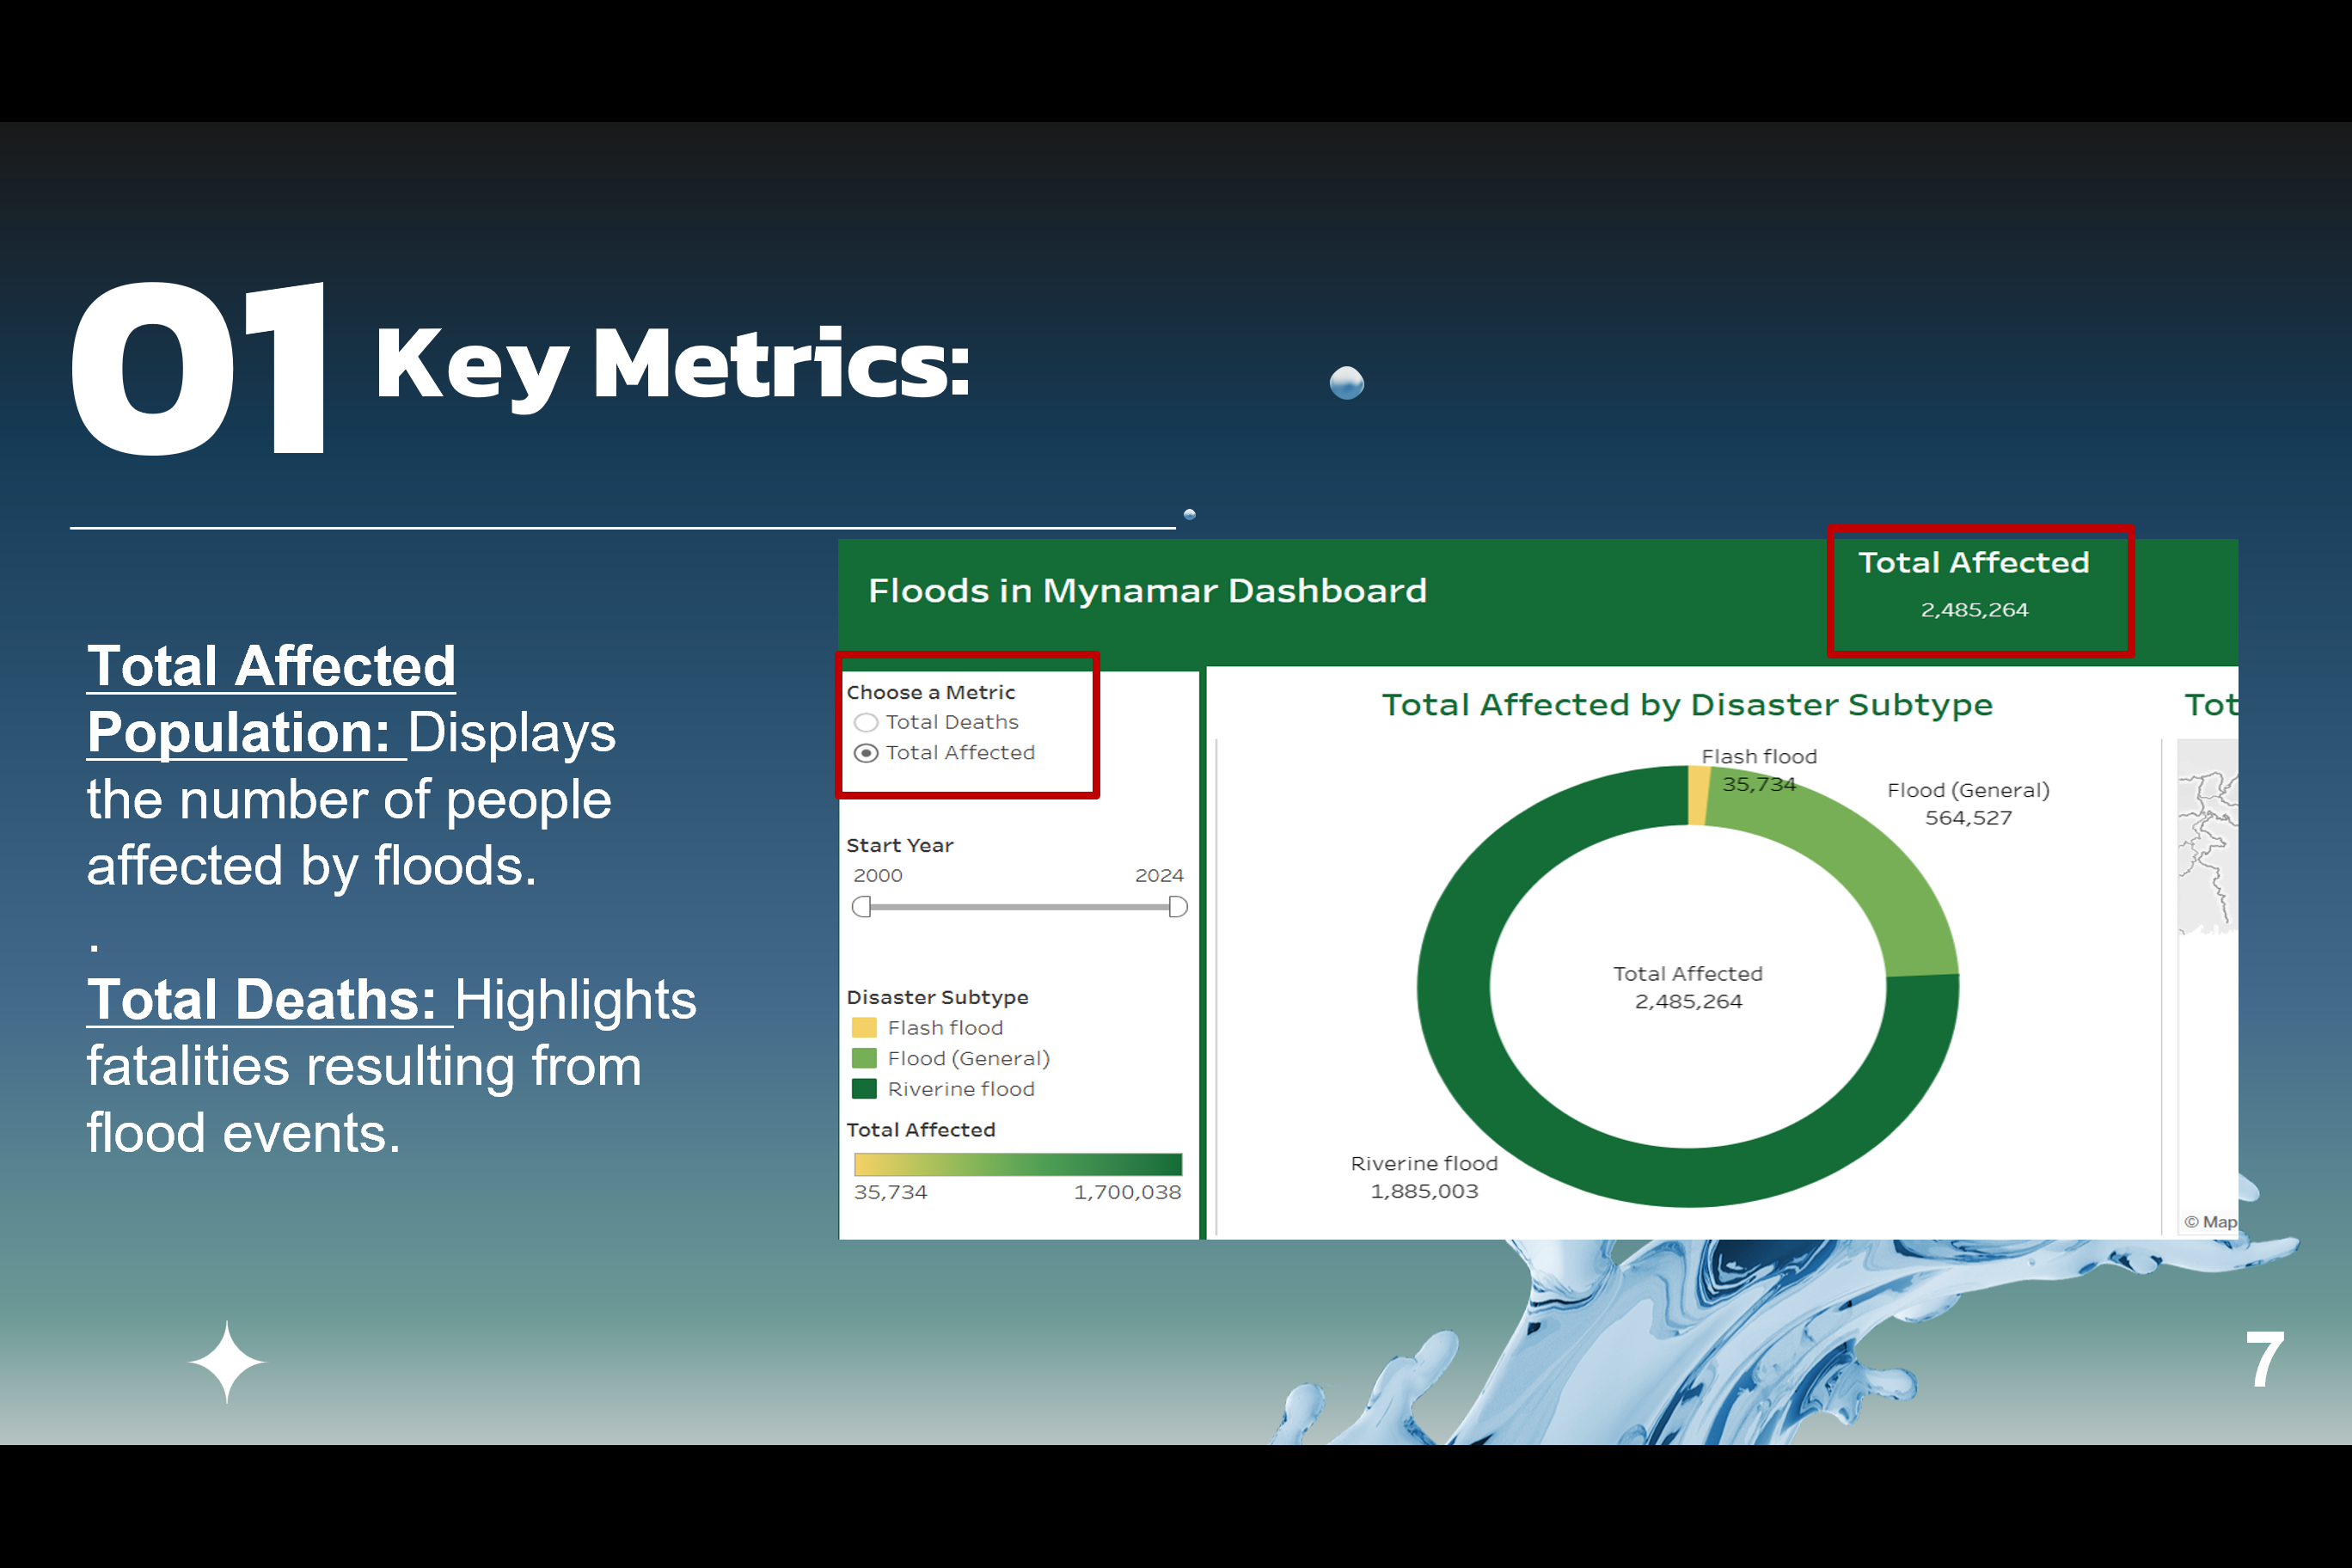
- Interactive Dashboards: We successfully built dynamic dashboards that give users a clear picture of flood patterns and their impacts, making complex data easier to understand.
- Data-Driven Insights: Our work with association rule mining revealed significant relationships in flood data, which can really help improve disaster response strategies.
- Positive User Feedback: We've received great feedback from users about how intuitive and easy to use our platform is, which is incredibly rewarding.
What’s Next for Flood Insights
- Feature Expansion: We’re excited to add more data layers, like climate trends and early warning systems, to enhance what our platform can do.
- User Feedback Integration: We plan to gather feedback from users to refine our interface and features based on their experiences and needs.
- Outreach and Education: We hope to partner with local organizations to provide training sessions on using our platform, empowering communities to better prepare for floods.
Appendix: Pros/Cons of Alternative Methods of Learning
Pros
- Interactive Experience: Our platform offers an engaging, hands-on way to learn, making complex data more approachable.
- User-Centric Approach: By prioritizing user feedback, we can ensure our platform evolves to meet the needs of its audience, enhancing usability and relevance.
Cons
- Learning Curve: Some users might find it a bit challenging to navigate the dashboards and visualization tools at first.
- Technical Limitations: Integrating multiple data sources and tools can sometimes lead to technical hiccups, affecting performance.
Acknowledgements
We want to express our gratitude to Dr. Gurdal Ertek for his invaluable advice and support throughout this project. His expertise and insights have been incredibly helpful.
Built With
- elevenlabs-(ai-voice-generation)
- google-docs
- google-sites
- orange
- tableau


Log in or sign up for Devpost to join the conversation.