Devpost
Participate in our public hackathons
Devpost for Teams
Access your company's private hackathons
Grow your developer ecosystem and promote your platform
Drive innovation, collaboration, and retention within your organization
By use case
Blog
Insights into hackathon planning and participation
Customer stories
Inspiration from peers and other industry leaders
Planning guides
Best practices for planning online and in-person hackathons
Webinars & events
Upcoming events and on-demand recordings
Help desk
Common questions and support documentation
Sort by:
Twitch for Education
Dashboard of sustainable indicators for decision makers. Comprehensive reading of data for a sustainable strategic vision.
Help medical professionals make decisions faster
An analysis on a virtual education platform used by one of the largest universities in the UK in order to apply insights to the times of the COVID-19 pandemic
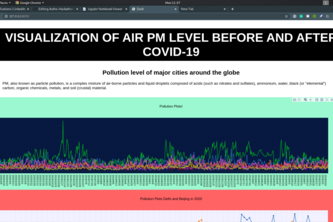
COVID-19: A Boon For Nature, This shows us that actually the covid outburst has been a boon for natural life. The dashboard shows us how...
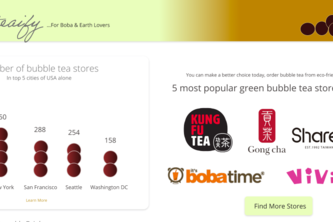
A bubble tea delivery platform that also encourages users to become more sustainable with their bubble tea consumption.
Social Justice through data Via determining peoples sentiment to Black Lives matter and finding safe places to protest based on coronavirus statistics
Water risk classification using keyword analysis.
A privacy-preserving, location-based exposure tracking system using Bluetooth stationary points, Checkpoints.
The one-stop shop for all things COVID-19! Population Density, COVID Forecasting, Policy Checking, COVID News, Help Resources
Giving teachers everywhere an accurate evaluation of their online teaching.
The idea of this project is to create a website which you can get data that is accurate about COVID-19 easily.
Personalized WFH wellbeing assistant
A Deep Learning Powered Coronavirus Visualization and Prediction Software
A user friendly tool to shed light on communities in need during the Covid-19 pandemic
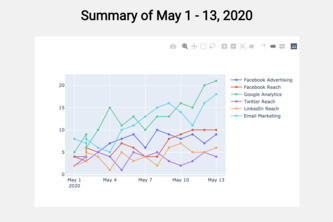
A user-friendly dashboard for NPLF marketing and communications staff in order to organize and analyze key marketing metrics related to the Foundation's online presence.
gauge how happy t
Analyzing and Visualizing the World Happiness Index Dataset
Ace your next Tech interview with Mrs. Career Wise. Amidst historic layoffs, it's best to be ready for any scenario.
A simple (absolutely simple) web-app for forecasting any univariate time series.
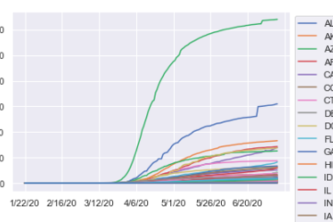
Studying and Visualizing US Covid-19 data
This web app will allow users to enter information regarding a vacation they would like to plan and the algorithm will scrape the web and generate a vacation plan.
ProductiviTech is a software that analyzes recorded meetings frame by frame, gathers metrics such as attentiveness, and displays them in a personalized dashboard. Record. Review. Ramp up productivity.
Our solution equips communities with a tool that leverages existing resources, data and community assets to track recovery and encourage sustainable funding throughout the process.