Devpost
Participate in our public hackathons
Devpost for Teams
Access your company's private hackathons
Grow your developer ecosystem and promote your platform
Drive innovation, collaboration, and retention within your organization
By use case
Blog
Insights into hackathon planning and participation
Customer stories
Inspiration from peers and other industry leaders
Planning guides
Best practices for planning online and in-person hackathons
Webinars & events
Upcoming events and on-demand recordings
Help desk
Common questions and support documentation
Sort by:
Your City Search Tool
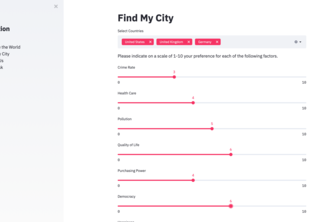
In order to best gauge which city suits an individual we have created an interactive web application involving data/ML techniques to optimize which cities are most desirable from individual tastes.
A chance to see the world made simple.
Where are students' opportunities for success the highest?
Visualization and prediction tool for the overconsumption of energy in a building.
City Search Tool Using Unsupervised Learning Algorithms. The main purpose of it is find a suitable city to move-in according to your priorities/personality traits.
We've created a web app to help you find cities in the U.S. that suit you!
A ML clustering-based web app to help users identify their dream city to live post COVID.
A web app that identifies vulnerable K-12 school districts affected by COVID-19 and advises HPE on how to help these communities best.
Giving students a tangible, and interactive math experience in a world that often makes math seem confusing.
Healthcare response in India is not up to the mark. We introduce a novel, low-tech workflow management system, to decrease workload on the community health workers and help government policy makers.
Healthcare delivery in rural areas is not up to the mark. We introduce a novel workflow management system, to decrease workload on the community health workers and help government policy makers
We made Zoom more engaging through computer vision, retro graphics, sentiment tracking, and data analytics.
lil app to convert sensor schematic drawings to graphs
A US stimulus check dispersion heat map of US counties
We created an interactive viz for the Chesapeake Bay, analysed the factors affecting nitrogen & phosphorous pollution with ML, and deployed time-series models to predict future pollution.
An unsupervised, data sensitive, personalized music recommendation algorithm where the recommendations are tailored to qualities YOU like in a song, not based on other user's data.
Analyzing FIRST Robotics Competition, or FRC, data using Tiger Graph for the back-end and Plotly Dash for the front-end.
Ace your next Tech interview with Mrs. Career Wise. Amidst historic layoffs, it's best to be ready for any scenario.
Enabling healthcare providers to improve opioid response plans through aggregated First Responder data.
This program can analyze any investment property on Zillow and automatically provide the analytics for it in a excel sheet. It will also pop up a website to teach you more about the different terms.
Know your customer. Understand your customer. Give your customer what it needs. Keep your customer.
All purpose radar for protesters to better and more safely organize mid-rally.
A web app showing the relationships between spending and incarceration rates and predicts correctional population rates with tensorflow