Devpost
Participate in our public hackathons
Devpost for Teams
Access your company's private hackathons
Grow your developer ecosystem and promote your platform
Drive innovation, collaboration, and retention within your organization
By use case
Blog
Insights into hackathon planning and participation
Customer stories
Inspiration from peers and other industry leaders
Planning guides
Best practices for planning online and in-person hackathons
Webinars & events
Upcoming events and on-demand recordings
Help desk
Common questions and support documentation
Sort by:
Credible is an integrated platform which enables the companies to analyse the standard aspects of business model like resume, product reviews, write-ups and tweets of recruits using expert.ai NL API.
"Can page views be used as proxy for good surfing conditions?" Using data from Windfinder, we explored the relation between weather data and how many people accessed the corresponding website.
Sentiment and emotional analysis of tweets on a user-defined topic using Elastic Search and graphical visualisation.
Send player performance result in real time to the coaches and the staff. The staff can use this to help plan out game strategy more efficiently picking up the best 5 players to play the basketball.
A WebApp for Faster and Easy Visualisation of NanoDtring Kidney Dataset
What if old histology slides could be retouched to show gene expression at a single cell level..? What if you could imagine what a single cell would look like, just from the gene expression..?
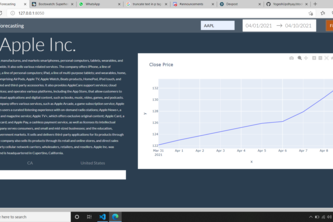
Stock price predictor provides visual data of the current market price of a particular stock and predicts its future prices as well
Carbon emissions from agriculture need to be designed out of our systems, but transparency remains a key issue. Through carbon labels on packaging we aim to provide greater clarity for consumers.
Ever think how much money you have spent? Ever want to see what your finances would be like if it kept up? Here you go!
Lets test takers find out more about what's under the hood of their test score.
We must admit we love memes. And Money. So we are taking the challenge upon ourselves to predict the price of Dogecoin 30 days into the future using past data and the power of AI.
Identify excessive fuel consumption in your fleet and optimize accordingly. Green Fleet is helping fleet managers save money and the environment.
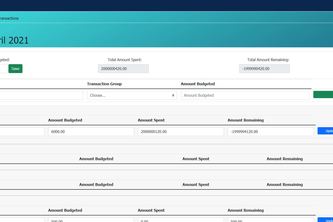
Personal finance web app which allows the user to create a custom budget and enter day-to-day transactions, complete with visualizations and budget summary statistics.
Stock visualizer helps users keep tracks of their stock investments.
Intelligent preference-based restaurant seating arrangement
SpaceJam is an analysis platform for performing data exploration, DE analysis, cell type abundance estimates and prioritized cell-cell interaction analysis on NanostringWTA data.
This is a streamlit web app for helping scientists dive into Kidney data provided by nanostring.
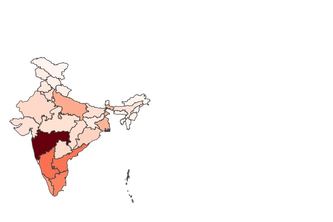
A starter project for visualisation of COVID data in India using Python
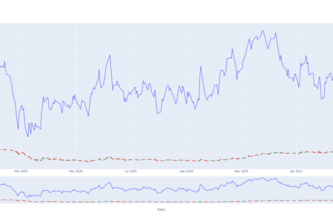
As we all know data visualization is a very important in stock markets. Two common real-time representations of stock prices are: candles and line graphs. I have tried to reproduce that
Data visualization is the graphical representation of information and data.
Ever had a problem in deciding which player to play. well now this EDA will help to identify it.
A tool to help you know when to buy and sell for different cryptocurrencies. Queries coinbase pro and saves values in MongoDB. Uses a genetic algorithm to select trading bots to predict prices
All the information you need about the police incidents reported on campus in one place.
Time-based analysis by creating custom metrics (filters) using simple GSQL statements. Let's the user see the custom metrics and visualize the corresponding objects as a graph.