-
-
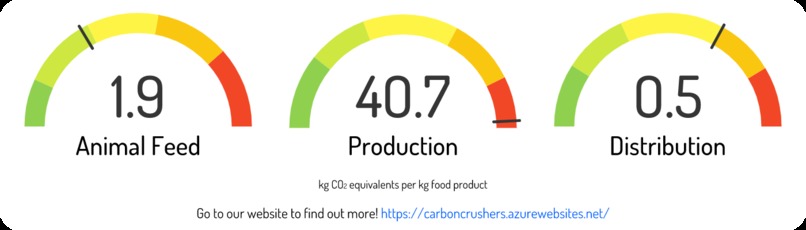
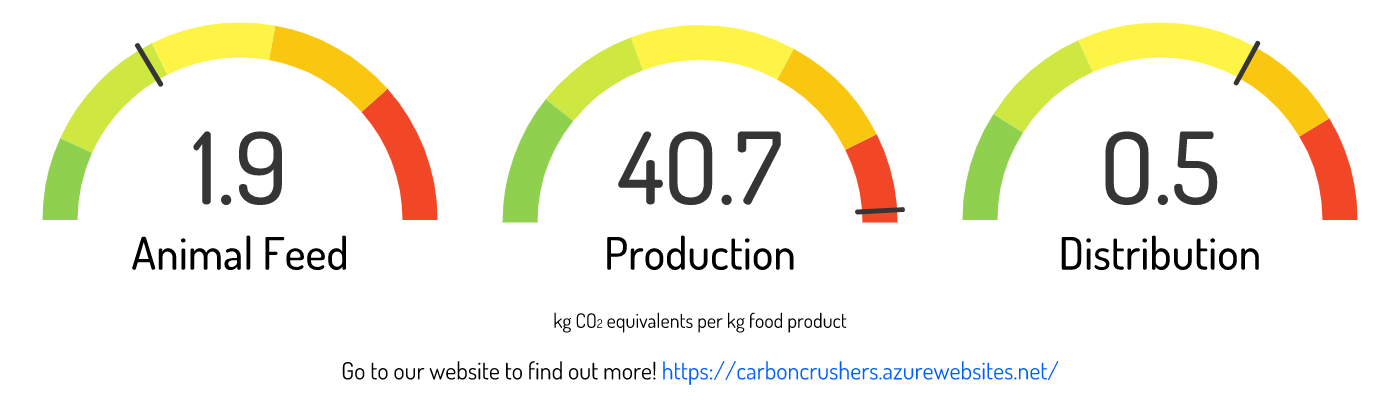
Example label for beef (beef herd)
-
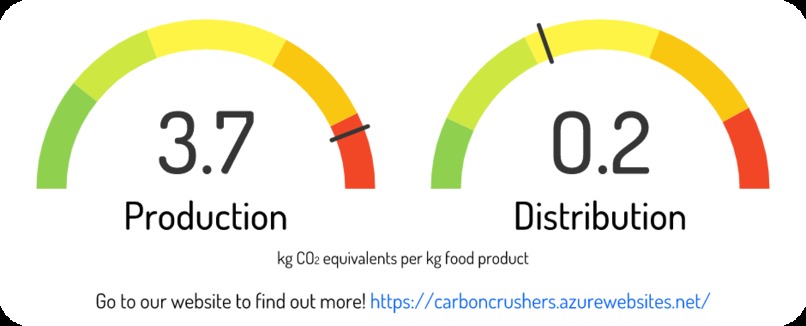
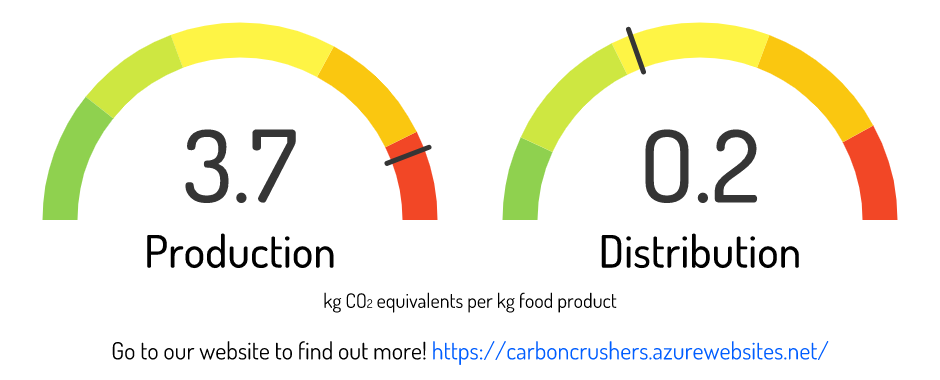
Example label for rice
Inspiration
Designing out carbon emissions from economic systems is one of many goals of a circular economy, and a main priority for the UK; it aims to see at least 68% reduction by 2030 and be net zero by 20501. We at Carbon Crushers are addressing one of the largest sources of carbon emissions: the agricultural industry2.
We were inspired by the traffic light nutrition labels (shown below) for food products. They are a perfect example of how labels can change consumer behaviour; they allow people to make more informed purchasing decisions and encourage more thought behind those choices3.

So we began our journey of making an equivalent food label for carbon emissions.
What it does
The label will be placed on food packaging and show gauges that indicate the absolute value of carbon emissions that a particular food item has produced, with a colour indicator which represents the relative significance of the value compared to other food products for the same stage of the supply process. These gauges will be a summary of the kg CO2 equivalents per kg product for the “Production” and “Distribution” stages of the food supply chain, with an additional third gauge for “Animal Feed” to be displayed on animal products only. The aim was to be concise whilst still providing impactful information. We have supplemented this information with a link to our website which contains a more detailed breakdown of the values shown on the label. A user may search for a certain product in the table using the search bar, and there is a sorting functionality to get a ranking of environmental impact per food supply stage or source (animal feed, farm, processing, transport, and packaging). Our goal is to inform consumers on the impact of their food with the intention that this information will result in a shift in buying practices. We hope that this will in turn put pressure on producers to evaluate their current processes and adopt better practices.
How we built it
We sourced data on greenhouse emissions at various stages of the food supply chain from a Kaggle dataset4. This dataset described the kg CO2 equivalents produced per kg product for a range of food products (including fruit, vegetables, grains, meat, and other animal products) during different stages of supply, and other environmental measurements such as land use and water use. We used Python and Jupyter Notebook to analyse the data and determine which metrics to use and how they will be used. Exploring the data with visualisations lead us to the decision to only include metrics that provided the kg CO2 equivalents per kg product, then grouping the measurements into two categories that each describe part of the food supply chain; “Production” and “Distribution”. The third measurement that could appear on a label, “Animal Feed”, was left ungrouped. The relative scoring of each product for each supply stage was determined by the 20th, 40th, 60th and 80th percentiles of the supply stage. We decided on percentiles because we wanted to fit the thresholds to the distribution of data for each stage of the food supply chain. This resulted in a 5-category system, with each category being akin to a score. This score was represented by the colour indicator on the label, where dark green is best and red is worst, and describes how carbon efficient a particular food product is in relation to other food products for the same part of the food supply chain. Once the percentile, minimum and maximum values for each stage of the food supply chain was calculated, it was transformed into a dataframe and exported as a JSON file for frontend use. This dataframe was used to create the colour indicator segments of the gauge plots, and the original dataset was used to obtain and display the absolute value of kg CO2 equivalents per kg product. We developed the website using the React framework. To display the data on the main page, we used the 'react-table' library. The library provided us with helpful features like sorting the table on all columns and filtering the data on user input. The filtering feature allowed us to add the search functionality. To plot the carbon emission labels in the table, we used the 'react-plotly.js' library. This library was the best option we've seen for embedding D3 charts in a React web application. We defined the 5 categories for our gauge plots within the ‘steps’ attribute of the gauge plot code, this allowed us to display the 5 different colours for each threshold. To make the website publicly available we decided to deploy it on Azure Cloud using a CI/CD pipeline. We used Azure DevOps Services to create the deployment pipelines. The first pipeline was created to build the code and publish the build artifacts. The second pipeline was a release pipeline. This was created to deploy the artifacts to our Azure App Service running in one of our developer subscriptions.
Challenges we ran into
- Lack of experience writing a website that suited our needs. Although learning on the go was a great experience!
- Considering available skills during our planning process. We realised that we could have spent some more time considering what our skills were when we started our planning process and use that to inform decisions about how we made our solution.
- Finding a dataset that would suit our needs. In particular, the most useful data seemed to be behind paywalls. We had to compromise and adjust our vision according to the available data.
- Communication could be difficult as we are all remote
Accomplishments that we're proud of
- For most of our team, this was our first hackathon! We enjoyed planning our own project and seeing it through from idea to fruition.
- We have learnt new web development skills. Specifically we managed to create a website that has a searchable data table and expands to show the labels.
- Created the visualisation of the data both as a dynamic JavaScript gauge for the website and as an illustration on Gravit as label design.
What we learned
- We learnt to pivot quickly due to problems faced that could not be resolved in two days and explore new ideas as they came.
- We were able to set ourselves realistic targets without overcommitting.
- As a result, we have produced two fully functioning products which we are proud of. There are multiple features that we would love to add to our solution, which we see only as a further opportunity.
- We have a greater appreciation for planning sessions and the time it takes to plan and coordinate a team
What's next for Carbon Crushers
In the future, we would like to make these extensions on our product:
- Multiple search filters on the website. It would be great to be able to compare two selected food products
- Gauges designed consistently with the labels
- Increase the coverage of food products
- More whole foods
- Specify brands/producers of these products
- Refined foods, consisting of more than one whole food Currently, the pressure is focused on producers to make more sustainable options, but responsibility also falls on retailers who buy from producers. Focus on retailers who are making progress on the carbon emissions/food waste space. Measures could include the percentage of crops rejected, percentage of food disposed of due to not being sold, and methods of disposal.
References:
[1] https://www.gov.uk/government/news/uk-sets-ambitious-new-climate-target-ahead-of-un-summit#:~:text=A%20new%20plan%20aims%20for,decade%2C%20compared%20to%201990%20levels.&text=The%20Prime%20Minister%20has%20today,2030%2C%20compared%20to%201990%20levels. [2] https://www.wwf.org.uk/updates/uks-carbon-footprint [3] https://link.springer.com/article/10.1007/s11747-019-00663-9#Sec14 [4] https://www.kaggle.com/selfvivek/environment-impact-of-food-production


Log in or sign up for Devpost to join the conversation.