-
-

Main Page with 7 Sets of Images
-
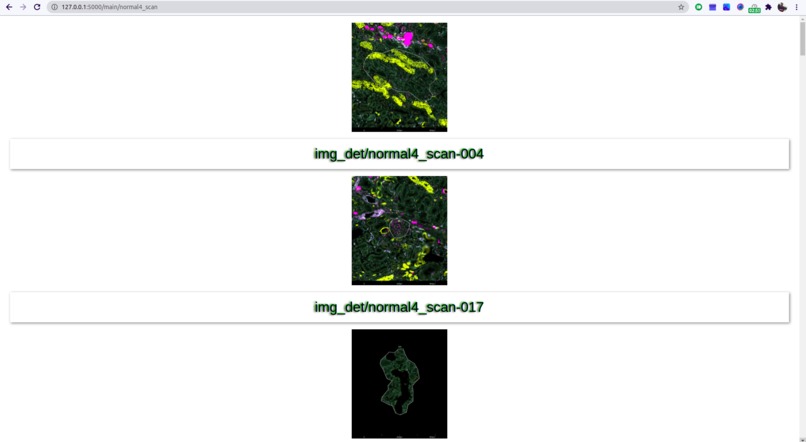
SubPage with ROI of Set
-

ROI Image Details
-

PLot of Target Name and BioProbes
-
https://www.spandidos-publications.com/10.3892/mmr.2017.7666
-

https://www.ncbi.nlm.nih.gov/pmc/articles/PMC4975268/


Inspiration
Many of my family members have Diabetes and hope this project can ease the researchers in the field so they can get a cure for Diabetes soon.
We know that it takes lot hardware resources (I just opened a single image from Dataset and my PC collapsed due to RAM overload) to visualise Slide Images in Biology due to its high resolution, so here I have made this WebApp which uses my optimised images from the NanoString Dataset and displays its Data easily and faster.
What it does
It is a WebApp developed using Python and Flask which optimises the dataset images and displays its features in form of graphs and plots with a easier and faster UI.
It shows major features of any ROI in Dataset like Normalization of Target Names, BioProbe Count and properties of the ROI.
How we built it
- I first optimised and compressed the dataset images using Python so it will load faster on the Web (100MB to >1MB), and also converted the text dataset to csv files.
- Then I created a Frontend in Flask with multiple pages to Display the Images in respective Order as Disease and Types.
- Then I researched about major Genes for Diabetic Kidney Disease from Research Papers and filtered them out from 15000 Target Names using Pandas Library
- Then similarly for BioProbes Value I mapped the Main Target Names filtered before and displayed using Graph Plot and the Dataset FIles "Sample Annotations: Kidney_Sample_Annotations.txt,Feature Annotations: Kidney_Feature_Annotations.txt,Probe Expression: Kidney_Raw_BioProbeCountMatrix.txt,Target Expression:Kidney_Raw_TargetCountMatrix.txt,Normalized Expression: Kidney_Q3Norm_TargetCountMatrix.txt".
- Then Finally merged all components into Local Flask Server
Challenges we ran into
- Plotting Bar Graphs was tricky as used the library for the first time
- Using the Big Image files from dataset was hard due to less RAM in my computer
Accomplishments that we're proud of
- Created Visualisation app with such a huge dataset for first time
What we learned
- Image Handling in Dataset
- Filtering Dataset's CSV files
- Plotting Bar Graphs in Python
What's next for Kidney Dataset Visualisation
- As the current UI is not so Good, so improving it using CSS and JQuery
- Adding more Visualisations and Analysing them


Log in or sign up for Devpost to join the conversation.