Devpost
Participate in our public hackathons
Devpost for Teams
Access your company's private hackathons
Grow your developer ecosystem and promote your platform
Drive innovation, collaboration, and retention within your organization
By use case
Blog
Insights into hackathon planning and participation
Customer stories
Inspiration from peers and other industry leaders
Planning guides
Best practices for planning online and in-person hackathons
Webinars & events
Upcoming events and on-demand recordings
Help desk
Common questions and support documentation
Sort by:
Interactive dashboard that showcases the history of COVID-19 in each state. Previous infection and death patterns caused by COVID-19 is used to forecast the number of cases.
Our goal is to target COVID-19 where it is most prevalent and recommend deployment of vaccines to those locations!
Consolidate Covid hospitalization data with CDR(confirmed cases/deaths/recoveries) data to bridge the gap of lacking available public hospitalization datasets.📊
An interactive map visualization tool that displays Twitter users' views of the COVID-19 vaccine.
Our project consists of three main components - an XGBoost machine learning model, a map, and Tableau visualizations. These three components are a powerful set of tools for Chevron stores.
Mood Boost helps users navigate through their lows and celebrate their highs.
A Dash application to visualize the spread of COVID-19 on a per-day basis rather than the current state, allowing for data to be easily collected for research purposes or trend-visualization.
Team DataDoctors insights on access to quality healthcare and what we believe to be its future, telemedicine.
Your go-to information hub for data-driven vaccine distribution strategy, live updates, and information
ReInvest is a philanthropic platform where people can purchase stocks under the name of a charity of their choice by a few highschoolers who love to invest.
Power to the Player and People. Join us and watch GME Skyrocket to the Moon on both Discord servers and the Web Browsers: https://gmetothemoon.space/.
Visualizing tweets about voter fraud during the 2020 US Presidential election
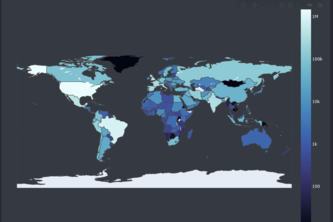
Python web app which plots worldwide country data on COVID-19
Ever wanted to know how diverse your classes are? Check CourseDems to see your class's racial and gender demographics!
As we all know uni students love alcohol, often in excess amounts. We wanted to create a website that shows your blood alcohol level over time, so you will know how long you will be intoxicated for.
Using weather data to determine bee honey production
Given how drastically COVID-19 has changed our lives in the past 10 months, our group felt compelled to create an interactive web app to visualize coronavirus statistics for Canada.
This project is intended show users how to create a simple data dashboard with Plotly Dash
Close to 800 000 people die by suicide every year. Suicides are preventable.If somehow we collect all data we definitely find the common reasons for suicides and stop this & save people's life.
SpotiNet offers users a new way to discover new music. Away with monotonous scrolling and navigate through intricate nets to discover your next favourite artists!
Interactive Model which Analyze your data elegantly
Build a Project That Uses a Data Set
COVID-19 World-wise Visualisation using jupyter lab
Curate your reading list with the top picks