What it does
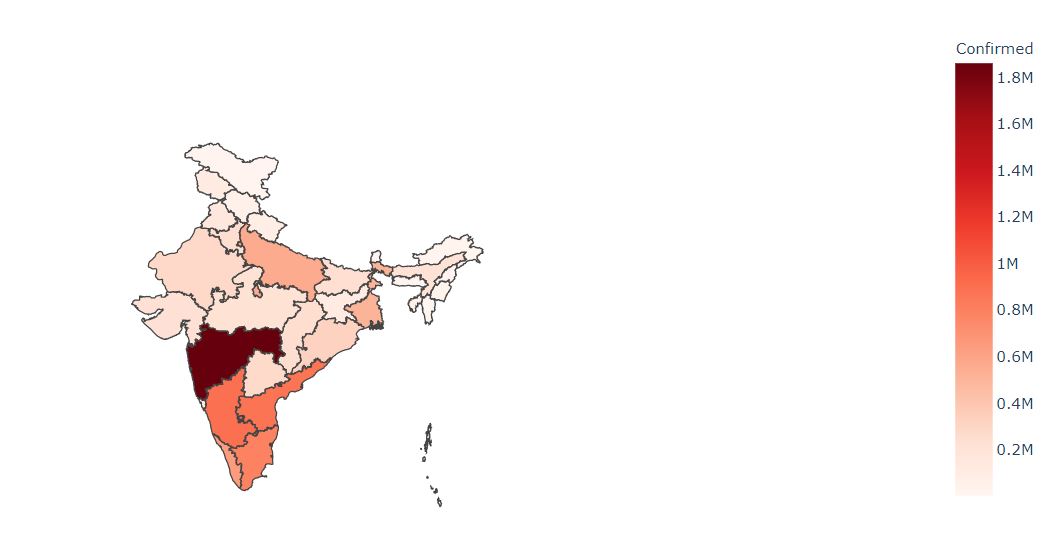
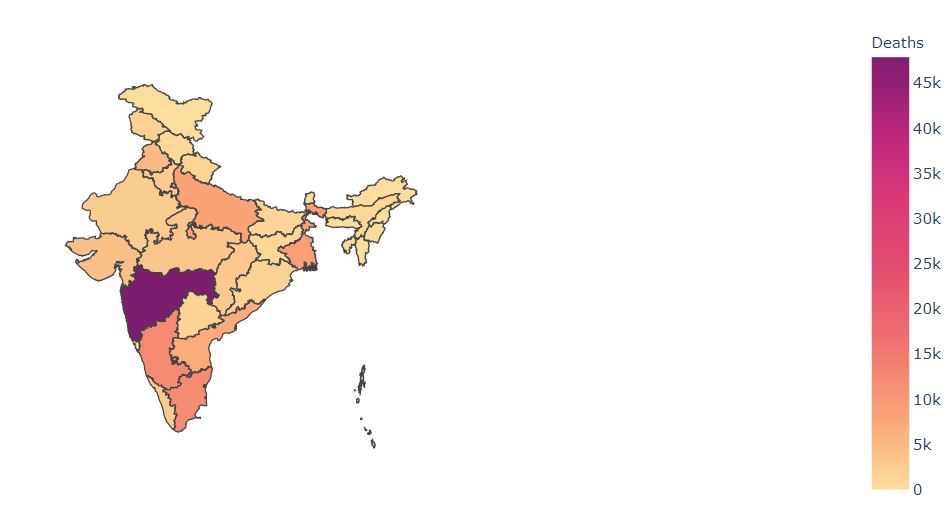
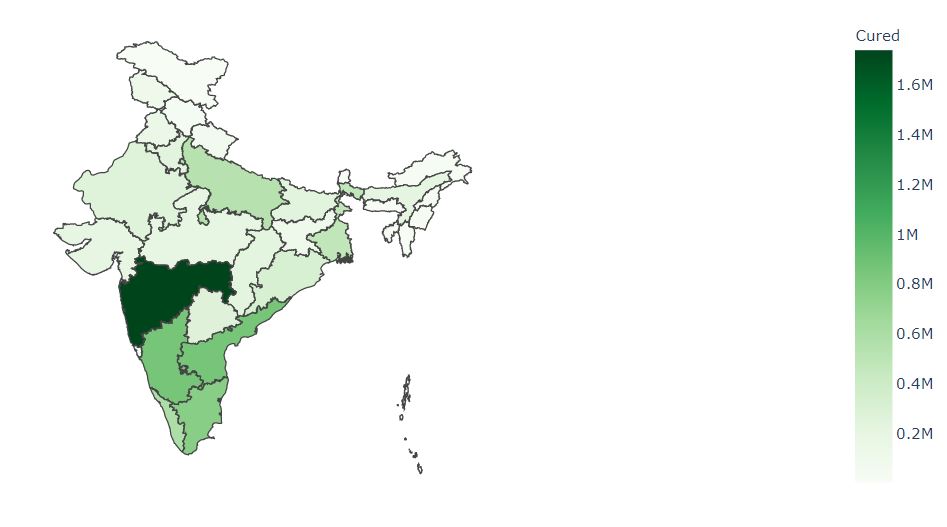
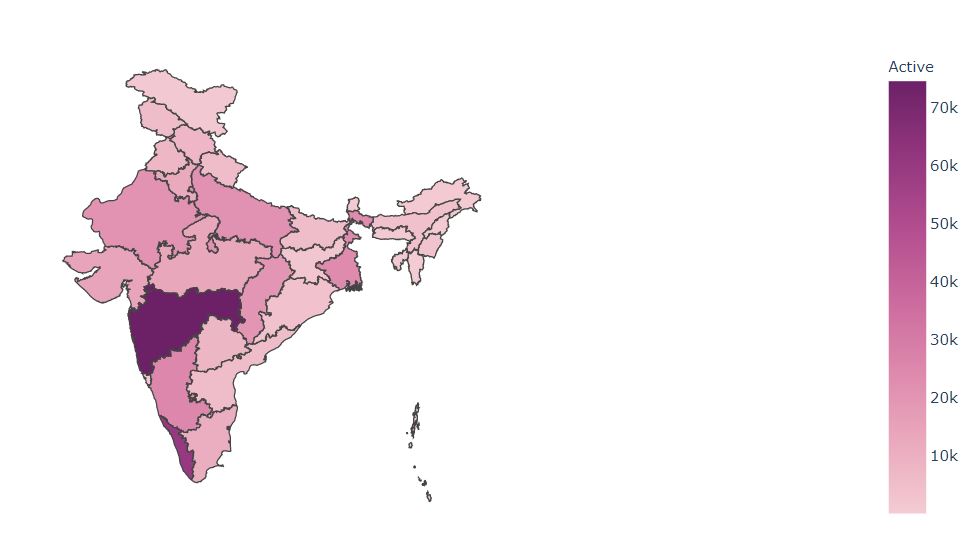
The notebook uses plotly to visualise confirmed, active, cured cases and deaths due to COVID in India. The dataset is updated till December.
How we built it
Using Python, plotly
Challenges we ran into
The plotting data for India was hard to find
What we learned
plotly is quite interactive

Log in or sign up for Devpost to join the conversation.