Devpost
Participate in our public hackathons
Devpost for Teams
Access your company's private hackathons
Grow your developer ecosystem and promote your platform
Drive innovation, collaboration, and retention within your organization
By use case
Blog
Insights into hackathon planning and participation
Customer stories
Inspiration from peers and other industry leaders
Planning guides
Best practices for planning online and in-person hackathons
Webinars & events
Upcoming events and on-demand recordings
Help desk
Common questions and support documentation
Sort by:
We visualize twitter and swiss news data, to show the hotspot of covid-19 related activity within Switzerland. We augmented this by sentiment analysis insights and compare to reported cases over time.
In-episode topic search for long podcast episodes like Joe Rogan, Lex Fridman or the Knowledge Project.
We created an interactive viz for the Chesapeake Bay, analysed the factors affecting nitrogen & phosphorous pollution with ML, and deployed time-series models to predict future pollution.
Analyzing FIRST Robotics Competition, or FRC, data using Tiger Graph for the back-end and Plotly Dash for the front-end.
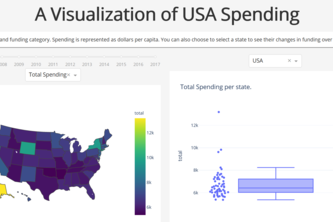
A web app showing the relationships between spending and incarceration rates and predicts correctional population rates with tensorflow
The goal of Nunafood is to use food production over-spill in one of these 4 cities(edmonton, montreal, ottawa, winnipeg) to address the food needs of Nunavut region which suffers from food insecurity.
Framför fyrir einstaklinginn, fyrirtækið & umhverfið
Dashboard of sustainable indicators for decision makers. Comprehensive reading of data for a sustainable strategic vision.
An analysis on a virtual education platform used by one of the largest universities in the UK in order to apply insights to the times of the COVID-19 pandemic
COVID-19: A Boon For Nature, This shows us that actually the covid outburst has been a boon for natural life. The dashboard shows us how...
A privacy-preserving, location-based exposure tracking system using Bluetooth stationary points, Checkpoints.
Personalized WFH wellbeing assistant
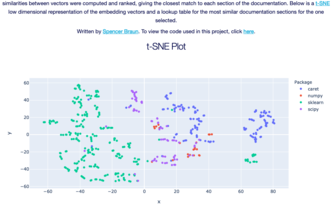
Similarity scores between ML framework documentation
A Deep Learning Powered Coronavirus Visualization and Prediction Software
A Python Dash application which provides visualizations of COVID-19 data.
A simple (absolutely simple) web-app for forecasting any univariate time series.
We are your partner in ensuring the safety of your people as well as your goods.
Our solution equips communities with a tool that leverages existing resources, data and community assets to track recovery and encourage sustainable funding throughout the process.
-
Dashboard for businesses (specifically small retail) to measure growth/vitality
Desenvolver uma ferramenta web que auxilie a análise de dados epidemiologicos no combate à COVID-19, a partir de um site interativo que leva em consideração as particularidades do Brasil.
An automated software which uses feature extraction to accurately differentiate between patients that have COVID-19 and those with diseases having similar symptoms, by analyzing their chest x-rays.
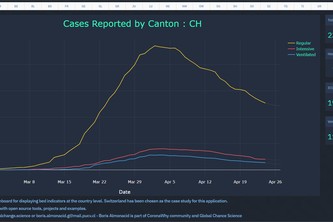
Dashboard for displaying bed indicators at the country level.
Develop a data-driven mathematical model of cytokine storm syndrome to identify targets for drug re-positioning