Devpost
Participate in our public hackathons
Devpost for Teams
Access your company's private hackathons
Grow your developer ecosystem and promote your platform
Drive innovation, collaboration, and retention within your organization
By use case
Blog
Insights into hackathon planning and participation
Customer stories
Inspiration from peers and other industry leaders
Planning guides
Best practices for planning online and in-person hackathons
Webinars & events
Upcoming events and on-demand recordings
Help desk
Common questions and support documentation
Sort by:
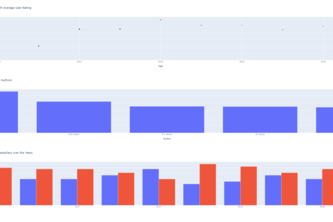
This project is intended show users how to create a simple data dashboard with Plotly Dash
SpotiNet offers users a new way to discover new music. Away with monotonous scrolling and navigate through intricate nets to discover your next favourite artists!
A Dash web app for visualising data for colonisation of bees in urban and rural areas.
Curate your reading list with the top picks
A Dash web app for visualising data in graphs and bar charts.
Know what twitter folks feel about COVID-19.
A website to aggregate the general sentiment towards certain crypto currencies. This sentiment is gotten through google cloud entity sentiment analysis and scraping social media sites about crypto
How long does it take to go from your house to other places in your neighborhood on foot, by bike, by transit, or by car? This 3D topographical map will show you how accessible your community is!
finNourish! your one stop destination to explore your preferred investments and deposits options and also monitor your assets.
GeoVisor is a visualization tool which can be utilized to identify and analyze industry clusters across large cities using HereData layers.The dashboard helps better understand regional economies.
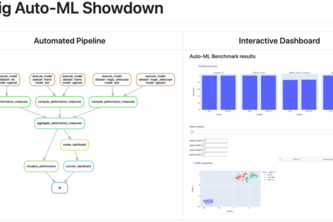
Auto-ML frameworks tend to make (deep) machine learning black boxes even darker. Instead of improving interpretability directly, let's conduct a benchmark to learn more about them.
Turn every laptop or handheld device into a ballot machine with Verivote. The world’s first face recognition app for securing elections.
A plant analysis tool to help you know how to grow
To bring awareness to and improve the lives of the public.
This website displays location-based analysis on Tweets that present islamophobic call-to-action, as well as how news headlines may influence hate speech on social media.
Intuitive Crop Health Monitoring System
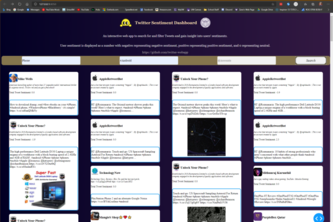
A dashboard diplaying tweets and their sentiment values based on a search query.
Your City Search Tool
Visualization and prediction tool for the overconsumption of energy in a building.
A simple data visualization dashboard to illustrate the current situation of bail in the Philadelphia Area.
We've created a web app to help you find cities in the U.S. that suit you!
A web app that identifies vulnerable K-12 school districts affected by COVID-19 and advises HPE on how to help these communities best.
Comparing the amount of research done in various countries during Corona times
We made Zoom more engaging through computer vision, retro graphics, sentiment tracking, and data analytics.