Devpost
Participate in our public hackathons
Devpost for Teams
Access your company's private hackathons
Grow your developer ecosystem and promote your platform
Drive innovation, collaboration, and retention within your organization
By use case
Blog
Insights into hackathon planning and participation
Customer stories
Inspiration from peers and other industry leaders
Planning guides
Best practices for planning online and in-person hackathons
Webinars & events
Upcoming events and on-demand recordings
Help desk
Common questions and support documentation
Sort by:
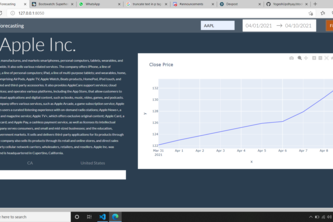
Stock visualizer helps users keep tracks of their stock investments.
Intelligent preference-based restaurant seating arrangement
Explore different clusters of data in a highly modular and versatile setting.
metahub
A virtual art gallery...except all the art is made by AI!
Something cool
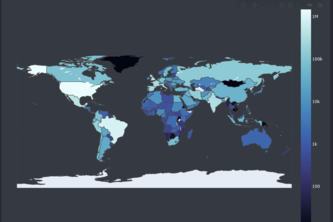
Includes an interactive world map & statistical representation of the countries that use various vaccines and which countries are vaccinating a larger percent of their population.
AccuVision provides a way for the general public to view real-time data for the number of people in an establishment, enabling them to make educated decisions in order to limit contact with others.
Carbon vision
PainPoint is a tool that helps improve communication in doctor-patient interactions by quantifying and standardizing the patients' experiences with pain.
Greener Calgary aims to facilitate solar energy adoption in Calgary. It forecasts energy prices/tax, collects solar intensity roof data and potential, and provides insights for expansion/savings.
Simplifying Stocks: Offering you suggestions on when to buy, sell, or hold and letting you know potential profit!
An interactive map visualization tool that displays Twitter users' views of the COVID-19 vaccine.
Our project consists of three main components - an XGBoost machine learning model, a map, and Tableau visualizations. These three components are a powerful set of tools for Chevron stores.
A Dash application to visualize the spread of COVID-19 on a per-day basis rather than the current state, allowing for data to be easily collected for research purposes or trend-visualization.
Visualizing tweets about voter fraud during the 2020 US Presidential election
Our main focus is to conduct a time series forecast on the closing price of Bitcoin for the next six months. Based on the prediction, we would like to build a tool that lets investors calculate ROI
Python web app which plots worldwide country data on COVID-19
As we all know uni students love alcohol, often in excess amounts. We wanted to create a website that shows your blood alcohol level over time, so you will know how long you will be intoxicated for.
See CO2, like never before.
Financial Dashboard
Play around with stocks
Simple dash application targetting FinTech folks
Given how drastically COVID-19 has changed our lives in the past 10 months, our group felt compelled to create an interactive web app to visualize coronavirus statistics for Canada.