Devpost
Participate in our public hackathons
Devpost for Teams
Access your company's private hackathons
Grow your developer ecosystem and promote your platform
Drive innovation, collaboration, and retention within your organization
By use case
Blog
Insights into hackathon planning and participation
Customer stories
Inspiration from peers and other industry leaders
Planning guides
Best practices for planning online and in-person hackathons
Webinars & events
Upcoming events and on-demand recordings
Help desk
Common questions and support documentation
Sort by:
A data visualization of terrorism attacks worldwide since 1970, including numbers of locations, numbers of casualties, and details of the attack.
A interactive webapp to visualize Covid 19 Statistics and Subscribe to regular Updates via Tweepy and Twilio Supported API
A dash app to visualize various stock exchange data from 1965 to the present.
San Francisco Police Department's guide for Smart Police Patrolling.
Dashboard and Stats of Applications available on the Apple App Store.
Obtain true financial freedom by learning Algorithmic Trading with Finberty, our financial data visualizing platform.
Schedule smart breaks from work using eye tracking
Interactive map of over 13000 cold cases from around the world.
A data visualization program that graphs different Canadian Covid-19 statistics
An interactive dashboard for analyzing police crimes and racial equity
Displays the trends of mental health disorder occurrence and awareness.
How much does each country's economic development depend on int'l loans/aid? I attempted to visualize this through data on the amount (in USD) of IBRD loans and IDA credits each countries received
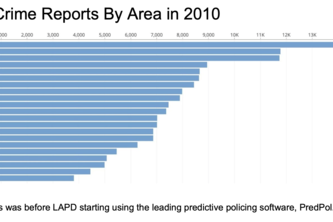
In our project, we looked at a crime dataset from LAPD and considered the effect PredPol, a predictive policing software, may have had on crime rates following its introduction.
Dashboard indicating the real-time status of monitoring parameters and provides critical alerts. This webapp will be useful for fleet owners who manage multiple cars for business such as TURO, UBER.
Pose Tracking and Machine Learning for prescribing corrective suggestions to improve posture and form while exercising.
The escalation of violence between Israel and Palestine in May amounted to large international condemnation. We aim to find patterns between media and public sentiment and opinion over the crisis.
Sentiment and emotional analysis of tweets on a user-defined topic using Elastic Search and graphical visualisation.
Send player performance result in real time to the coaches and the staff. The staff can use this to help plan out game strategy more efficiently picking up the best 5 players to play the basketball.
What if old histology slides could be retouched to show gene expression at a single cell level..? What if you could imagine what a single cell would look like, just from the gene expression..?
A healthcare application which focuses solely into passing alert to the people in and around their vicinty and updating them with the necessary resources and requirements during the pandemic.
Stock price predictor provides visual data of the current market price of a particular stock and predicts its future prices as well
Ever think how much money you have spent? Ever want to see what your finances would be like if it kept up? Here you go!
Identify excessive fuel consumption in your fleet and optimize accordingly. Green Fleet is helping fleet managers save money and the environment.