Inspiration
I wanted to work only in python because I was comfortable in it. I searched python apps for data vizualiation and I found dash by plotly. I was blown away after looking at this. I decided to use dash to build my app. I used a kaggle dataset.
What it does
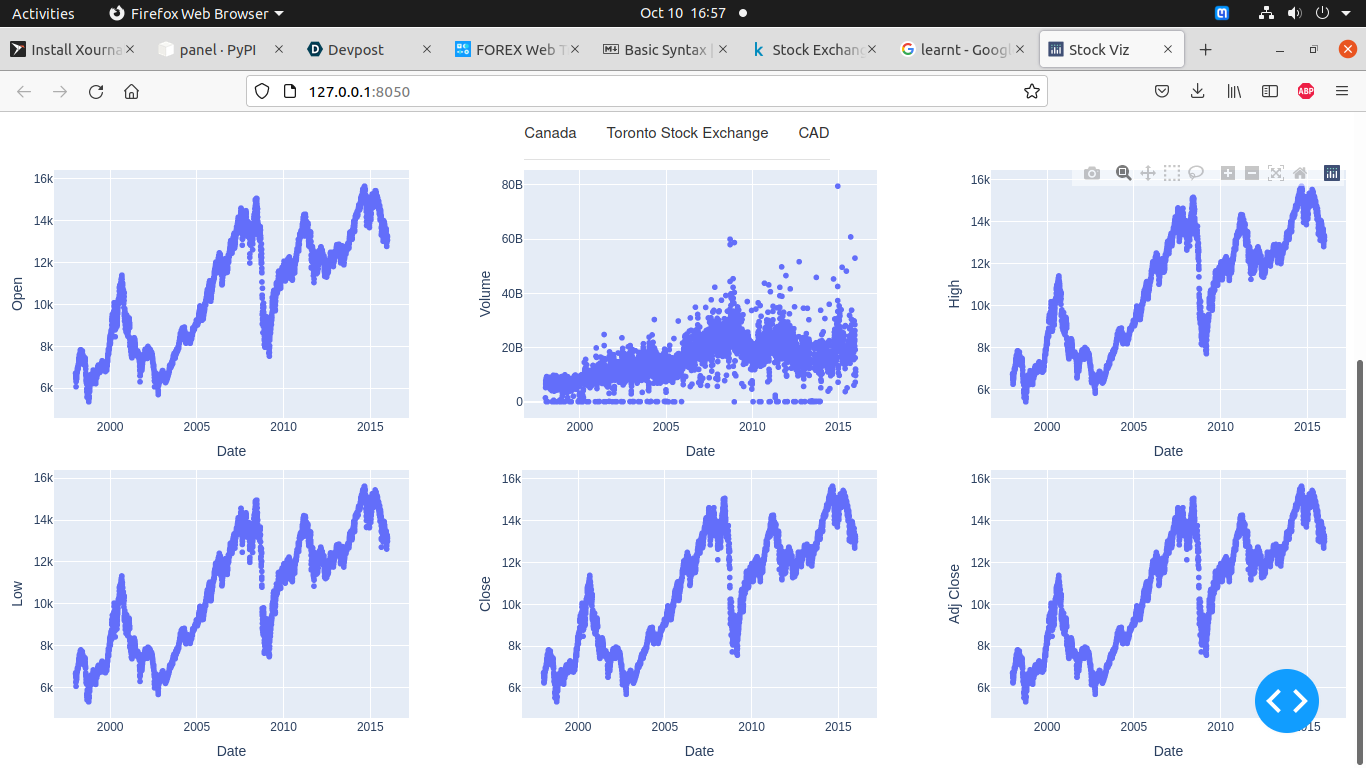
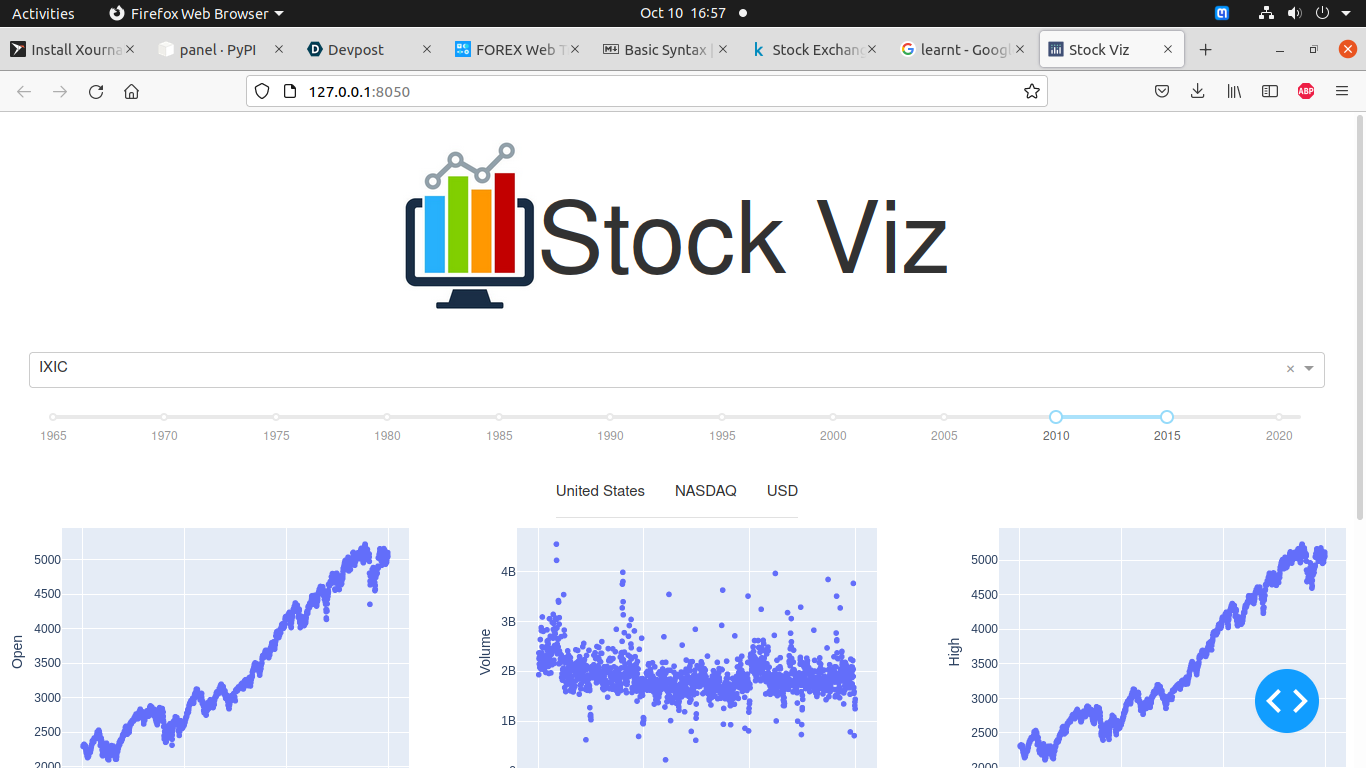
It plots the stock data from various stock exchanges - NYA, IXIC etc. It displays info like opening price, volume which is the number of shares traded during trading day etc. A slider is provided which can be used to view the data between a given time interval.
How we built it
pandas,dash
Challenges we ran into
- resolving the ui errors.
- deploying on gcloud
- git errors ## Accomplishments that we're proud of
app looks better than I expected
What we learned
designing responsive ui using dash
What's next for StockViz
use api calls to get the live stock info

Log in or sign up for Devpost to join the conversation.