Devpost
Participate in our public hackathons
Devpost for Teams
Access your company's private hackathons
Grow your developer ecosystem and promote your platform
Drive innovation, collaboration, and retention within your organization
By use case
Blog
Insights into hackathon planning and participation
Customer stories
Inspiration from peers and other industry leaders
Planning guides
Best practices for planning online and in-person hackathons
Webinars & events
Upcoming events and on-demand recordings
Help desk
Common questions and support documentation
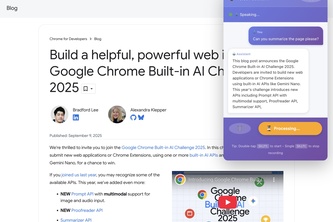
AI-powered Chrome extension that helps visually impaired users navigate the web through voice. The AI can see pages via screenshots, click buttons autonomously, and respond naturally—all on-device.
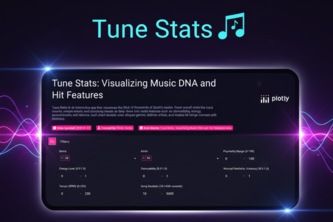
Visualizing Music DNA and Hit Features.
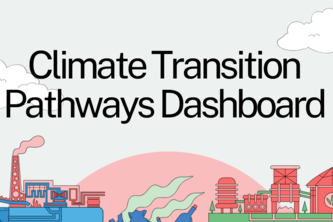
How do climate & different economies evolve under different scenarios & changing policies?
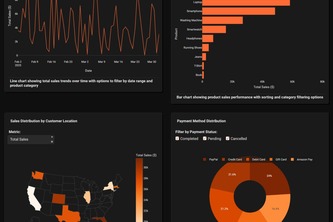
Comprehensive analysis of online sales data including order trends, customer behavior, product performance, and payment patterns across different categories and locations.
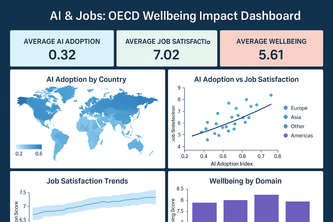
Interactive dashboard analyzing AI’s impact on jobs, income, work-life balance, and wellbeing across OECD countries using AI-driven insights.
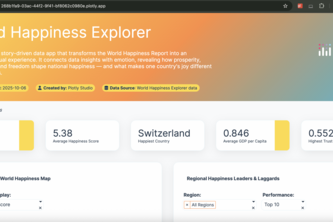
The app brings analytics to life with narrative insights, dynamic filters, and country-level comparisons to uncover what truly makes nations happy.
Cute pink dashboard, focusing on women's well-being
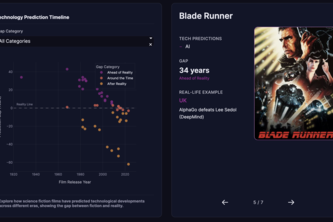
FutureFrames visualizes how science fiction films have predicted real technologies revealing which cinematic visions came true, which are still fiction, and how close movies have been to reality.
A data app that visualises the history of global volcanic eruptions, including geographic hotspots, eruption power and scale, historical trends, and the most powerful volcanoes in recorded history.
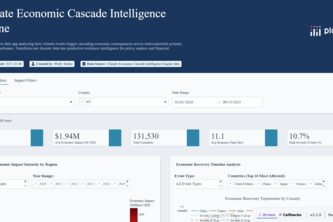
Revolutionary AI dashboard revealing hidden economic cascade patterns in climate disasters, transforming 3,000+ global events into predictive resilience intel.
An interactive Plotly Dash app that brings trust to life by visualizing Mint → Verify → Attest → Seal events as a living graph of verifiable identity.
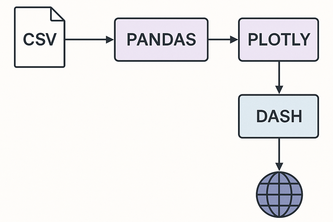
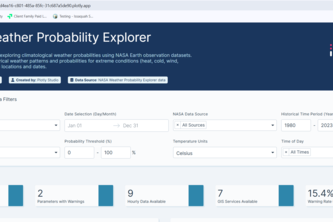
DataSky Protype App uses NASA Earth observation sample data to calculate the likelihood of extreme heat, rain, wind, or uncomfortable weather.
Invest Smart, Spot Tomorrow’s Winners Today.