-
E-commerce Sales Analysis

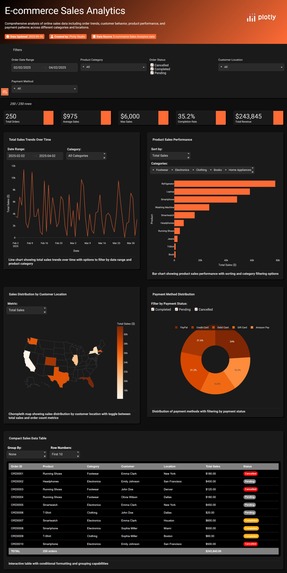
E-commerce Sales Analytics
The dashboard provides a comprehensive overview of online sales data, focusing on order trends, customer behavior, product performance, and payment methods across various categories and locations, for the period between 02/02/2025 and 04/02/2025.
Key Metrics:
- Total Orders: 250
- Average Sales: $975
- Maximum Single Order Sale: $6,000
- Order Completion Rate: 35.2%
- Total Revenue: $243,845
Sales Trends Over Time:
- Sales fluctuate throughout the analysis period, with notable peaks and dips.
- Visualized through a line chart, letting users filter by date range and category.
Product Sales Performance:
- Top-performing categories: Home Appliances, Electronics, Footwear.
- Best-selling products: Refrigerator, Laptop, Smartphone.
- Users can sort/filter the bar chart by total sales and category.
Geographic Distribution:
- The sales distribution varies widely across U.S. states.
- Top locations by sales include New York, Texas, and California.
- A choropleth map visualizes sales data by customer location.
Payment Methods:
- The most used methods: Credit Card (24%), PayPal (21.6%), Debit Card (21.2%).
- Users can filter the donut chart by payment status (Completed, Pending, Cancelled).
Sales Data Table:
- The table lists detailed sales data including Order ID, product, customer, location, total sales, and status.
- Statuses are color-coded: Cancelled (Red), Pending (Grey), Completed (Yellow) for quick recognition.
- Total orders: 250, Total revenue matches dashboard metric ($243,845).
Overall Insight:
The dashboard offers a clear, interactive view of e-commerce operations, helping identify top products, high-performing regions, popular payment options, and overall sales health during the specified period.
Built With
- plotlystudio


Log in or sign up for Devpost to join the conversation.