Inspiration:-
The Indian stock market is highly dynamic, reflecting both domestic economic shifts and global financial trends. I was inspired to analyze these patterns and uncover which companies are likely to be future-proof, helping investors make data-driven decisions in an uncertain market.
What it does:-
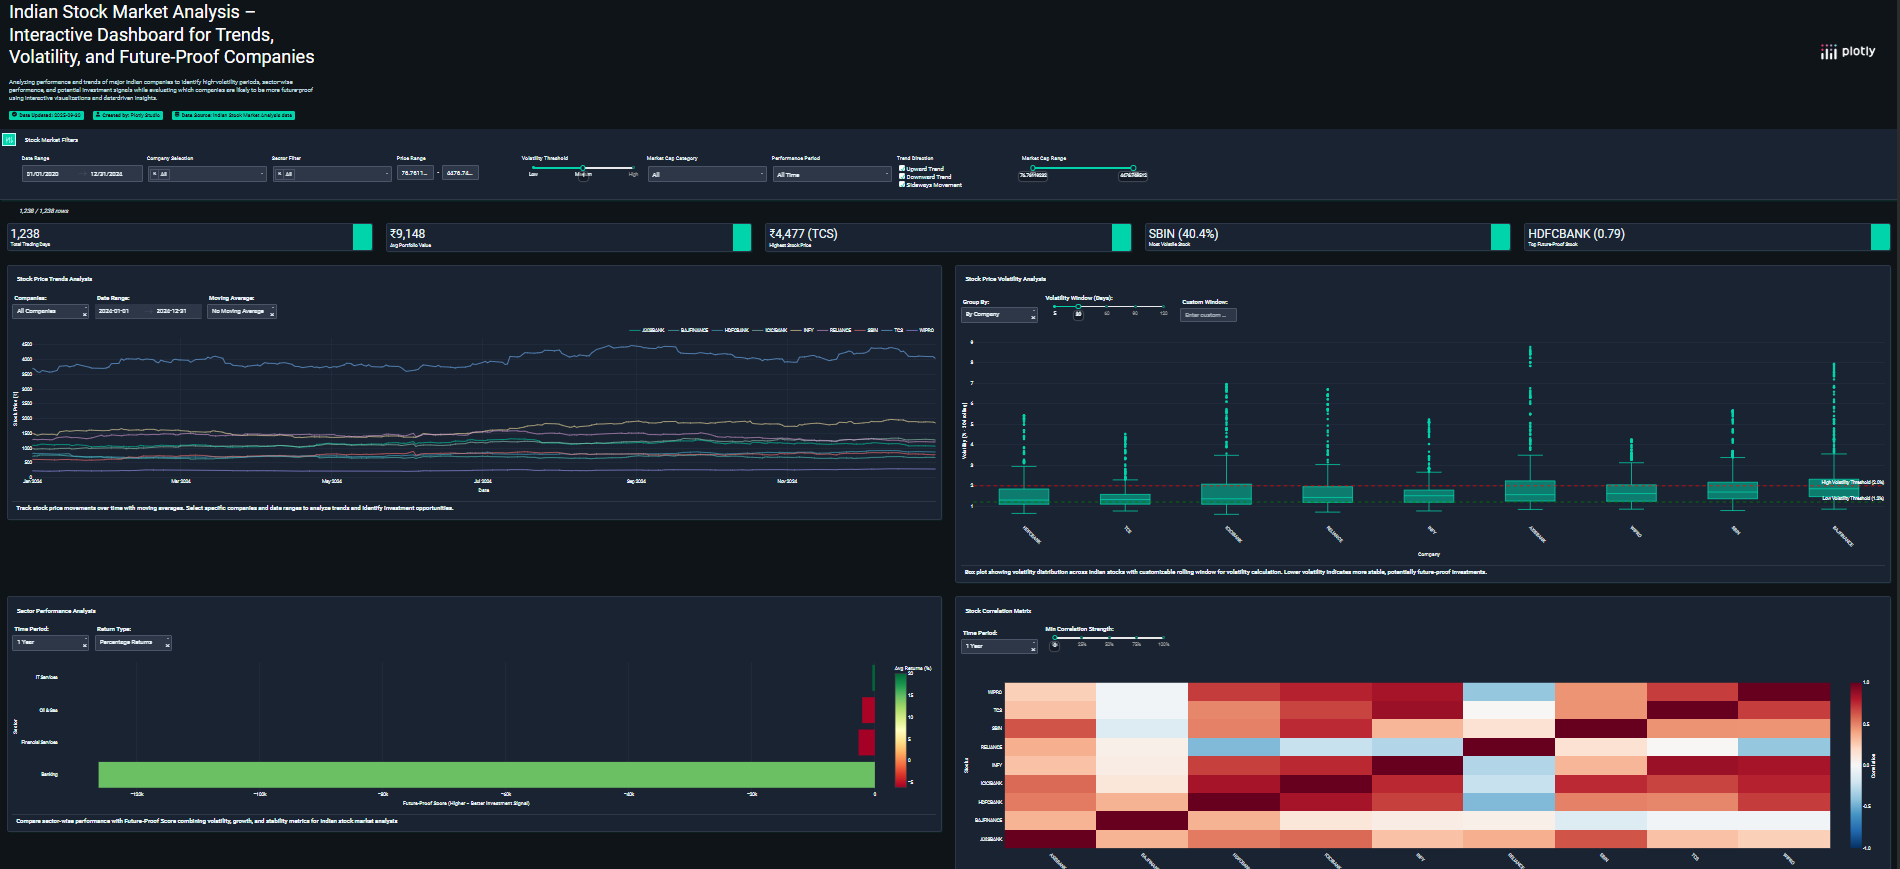
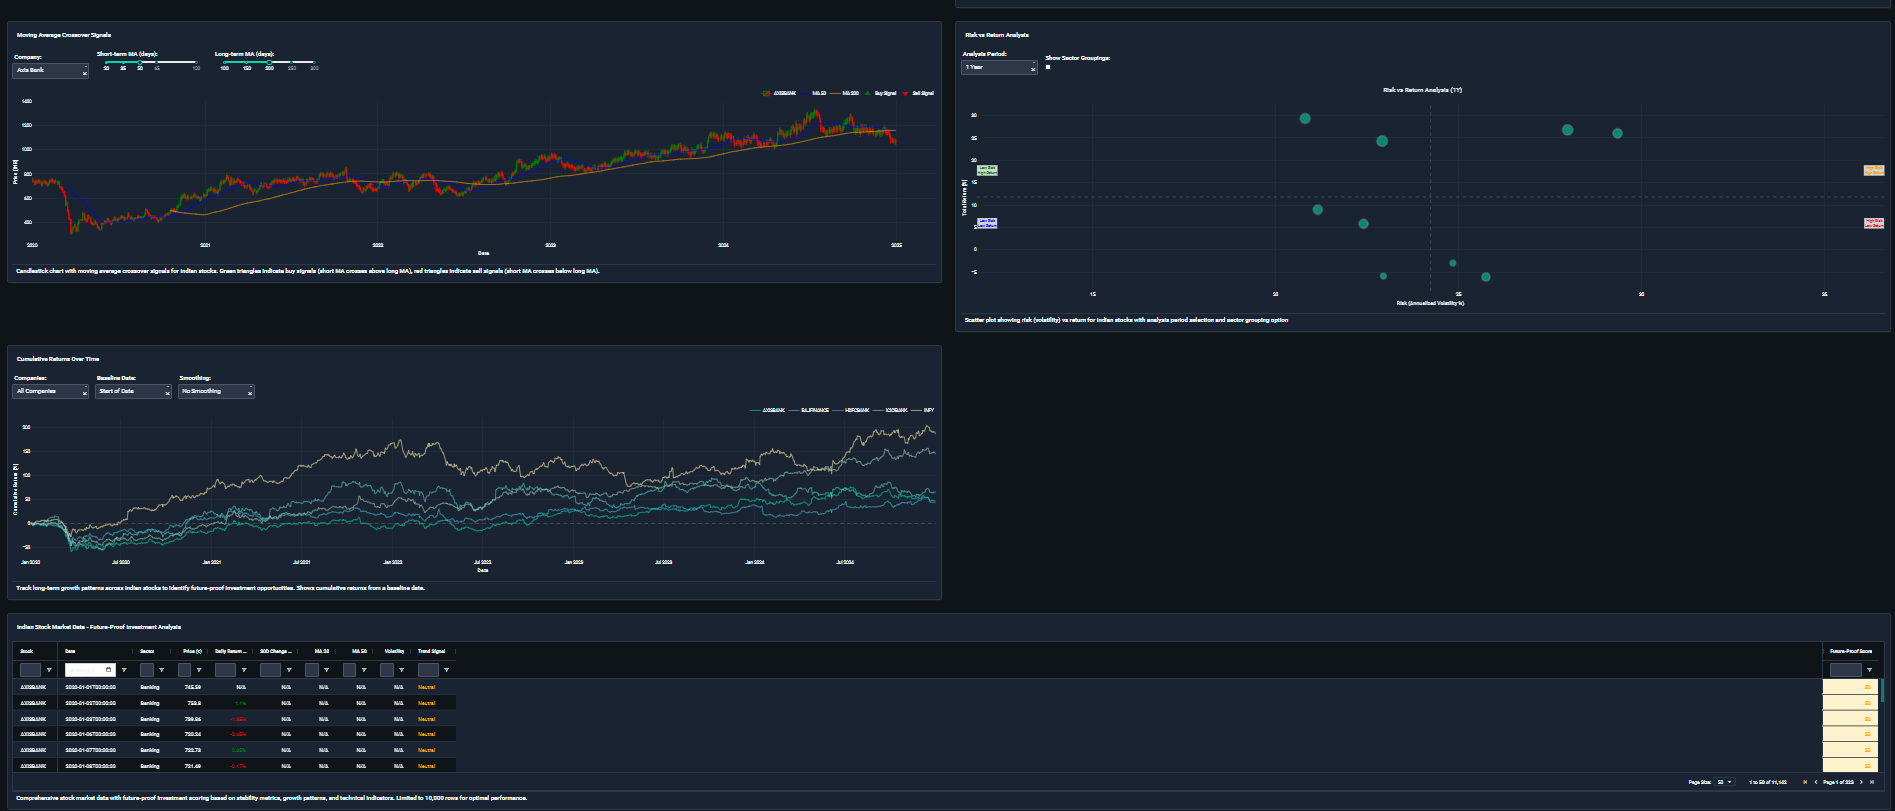
Indian Stock Market Analysis is an interactive dashboard that analyzes historical stock prices of major Indian companies. It identifies: 1.Price trends and high-volatility periods. 2.Sector-wise performance comparisons. 3.Moving average crossover signals. 4.Risk vs return patterns. 5.Future-proof companies using a composite Future-Proof Score. The dashboard helps investors and analysts make data-driven decisions by visualizing trends, correlations, and investment signals in a clear, interactive format.
How we built it:-
Data Collection Historical stock prices for major Indian companies were collected in CSV format. Data Preprocessing Converted dates into datetime objects. Calculated several key metrics: Volatility We measured volatility as the standard deviation of daily returns: Volatility = \sigma(\text{Daily Returns}) \] #### Growth Rate The overall percentage growth in price was calculated as: \[ Growth\ Rate = \frac{P_{end} - P_{start}}{P_{start}} \times 100 \] #### Moving Average Signals We generated buy/sell signals based on short-term and long-term moving averages: \[ MA\ Signal = \begin{cases} \text{Buy}, & \text{if } MA_{short} > MA_{long} \\ \text{Sell}, & \text{otherwise} \end{cases} \] #### Future-Proof Score A composite metric combining volatility, growth, and trend stability into one interpretable score. ### Visualization We used Ploty to create interactive visualizations, including: - Line charts - Candlestick charts - Box plots - Scatter plots - Heatmaps ### Dashboard Design - Dark theme with navy-blue and green accents - Filters for: - Date - Company - Sector - Market Cap - Volatility - Trend Direction --- Do you also want me to rewrite the other sections (like Challenges, Accomplishments, What we learned) in the same Markdown + LaTeX style?
Challenges we ran into:-
Inconsistent CSV formats and missing data. Creating a Future-Proof Score that meaningfully combined multiple metrics. Designing filters that update multiple charts simultaneously without lag. Keeping the dashboard responsive and visually appealing with multiple interactive charts.
Accomplishments that we're proud of:-
Developed a full-featured, interactive dashboard for analyzing Indian stock data. Successfully implemented Future-Proof Score to highlight long-term resilient companies. Designed multiple interactive charts with dropdowns, sliders, and date range pickers for deeper analysis. Created a dark-themed professional UI that is visually appealing and intuitive for users.
What we learned:-
How to clean and preprocess real-world financial datasets. How to implement financial metrics and technical indicators like volatility, growth rate, and moving average signals. How to use Ploty for interactive data visualization effectively. How to combine UX design and data analysis in a professional dashboard.
What's next for Indian Stock Market Analysis:-
- Incorporate more companies and sectors for broader analysis.
- Add predictive analytics and machine learning models for forecasting stock trends.
- Include news sentiment analysis to correlate market movements with economic events.
- Enhance the Future-Proof Score with additional metrics like dividend history, P/E ratio, and earnings consistency.


Log in or sign up for Devpost to join the conversation.