Devpost
Participate in our public hackathons
Devpost for Teams
Access your company's private hackathons
Grow your developer ecosystem and promote your platform
Drive innovation, collaboration, and retention within your organization
By use case
Blog
Insights into hackathon planning and participation
Customer stories
Inspiration from peers and other industry leaders
Planning guides
Best practices for planning online and in-person hackathons
Webinars & events
Upcoming events and on-demand recordings
Help desk
Common questions and support documentation
Sort by:
Diagnosis and Severity Score in Response to Speech
Track disease prevalence and provide solutions using socioeconomic and healthcare data.
Spark a conversation with an AI using facial + emotion recognition and view an emotion visualization dashboard
Back and forward buttons are obsolete. Visual History maps your walk on the internet graph.
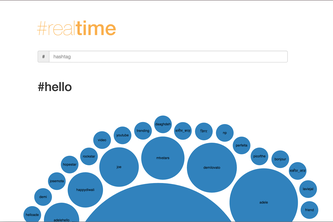
Bringing diversity to your search in #realtime
Lifestyle management tool for dementia creating a shared common language between the patient, family, and caregiver.
Caregivers easily track symptoms and successes; researchers get standardized, longitudinal data in real time.
Monitor your server infrastructure in real time using a simple daemon and web interface.
clean data for voters
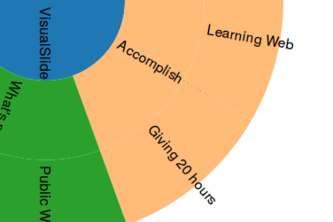
Giving context, a big picture if you will, to powerpoint presentations
Warcraft
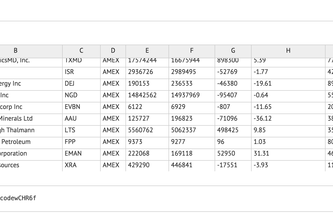
Combining the ease of Excel with the power of Python and D3
crAIg is a self-teaching neural network AI build to learn to play Super Mario Bros.
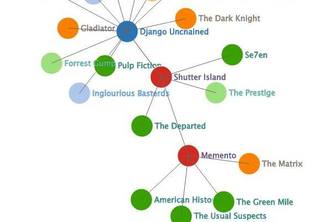
MyMDb is a graph-based visual tool that allows people to explore and discover new movies.
Crowd-sourcing clean energy with charging bike. Move around, save the planet
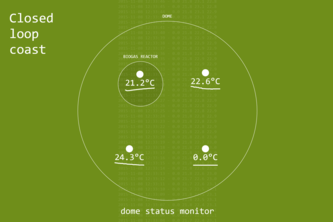
Hacking sustainable food and energy production in a closed loop cycle. Monitoring to get the processes right.
A web app that graphs the mood of a twitter user's recent tweets
Visualize Rhymes in Raps
Integrated diagnosis cloud for doctors, built upon your corpus of natural language data.
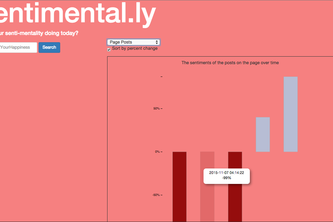
Analyzing the Positivity of Facebook Pages
Helping the UMass IEEE Student Branch to go paperless! Logging all snack shop sales by hand is a pain. No More!
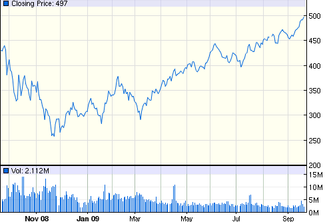
A Behavioural Economics Based Financial Prediction Report for Companies and Investment Bankers
Prediction and visualization of armed conflict events.
What's Local?--A Visualization Tool For Exploring Agricultural Production & Resource Expenses Near U.S. Urban Areas