Devpost
Participate in our public hackathons
Devpost for Teams
Access your company's private hackathons
Grow your developer ecosystem and promote your platform
Drive innovation, collaboration, and retention within your organization
By use case
Blog
Insights into hackathon planning and participation
Customer stories
Inspiration from peers and other industry leaders
Planning guides
Best practices for planning online and in-person hackathons
Webinars & events
Upcoming events and on-demand recordings
Help desk
Common questions and support documentation
Sort by:
Exploring the communities which grow food for us here in the United States.
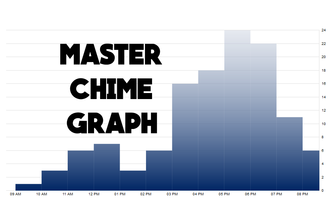
Graphs the activity level of our university computer repair center.
Data visualization tool using farmer information
Visualizing agricultural statistics of major crops in the United States
Data mining on an acoustic.
Visualize your cover letter's compatibility with jobs.
Multidimensional visualization tool for more equitable water usage and decision making in California
Emissions Vizualization!
A visual snapshot of the cereal grain industry
fist of five
Students are often afraid to criticize teachers. Arpeggio solves this by creating fantastic anonymous feedback forms.
Communicate document links to your employees using a secure passcode - Powered by Whispir
Harness the power of data to feed the world
Check how positive your twitter feed is
List of top trending open source repositories and developers in Bitbucket every week
A social network built to express emotions
Quickly analyse and convert force graphs from a sketch to an interactive D3 model.
Based off of psychological research on internet usage, WebYou can help tell you more about you from your web usage.
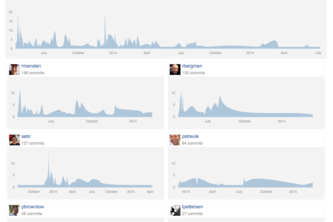
A bitbucket contributions/contributors graph
A chrome extension for analyzing your browsing habits
An amazing way to visualize New York
A collaborative whiteboarding/drawing app with support for saving, restoring, sharing, and more.
User interactions between Meteor and D3.
Just a simple visual of singapore