Devpost
Participate in our public hackathons
Devpost for Teams
Access your company's private hackathons
Grow your developer ecosystem and promote your platform
Drive innovation, collaboration, and retention within your organization
By use case
Blog
Insights into hackathon planning and participation
Customer stories
Inspiration from peers and other industry leaders
Planning guides
Best practices for planning online and in-person hackathons
Webinars & events
Upcoming events and on-demand recordings
Help desk
Common questions and support documentation
Sort by:
We bring targeted advertisement to the next level with finding patterns in mobile application usage
Prevent seafood fraud & mislabelling: secured with Cryptocurrency & Machine Learning methods
employ individual usage patterns and tariff structures to minimise the collective bill for shared solar pv
LifePal gives users a change to prepare for their college life. Let us be your first college buddy!
An optimized Staten Island bus hub network
Bus speed statistics about Staten Island
We can read your mind (waves) with an eeg headband and some machine learning magic. Just try to deceive us.
Galapagos is a comparative viewer for simulator output.
Steam game discovery engine
Convert Dataset Into Visual Insights With Minimal Setup
An app that uses data modeling and machine learning to tell you where the pollution in a city comes from in 15 years
More than 400,000 people in Chicago live in food deserts. To help, we created an interactive map to spread awareness.
Actionable recommendations to increase graduation rate using machine learning along with interactive visualizations
Combining the ease of Excel with the power of Python and D3
Help Beijingers with exposure to toxic levels of air
Solaropia is a web service to help homeowners calculate the solar potential of their residence.
Crop Compass makes Oregon's growing data easily accessible and interactive
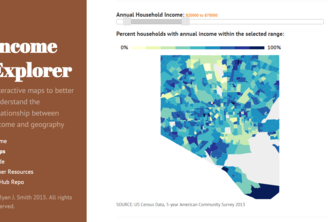
Interactive maps to better understand the relationship between income and geography
Interactive data visualization for rising sea levels.
US Railroad accidents and injuries, visualized
Informative&creative interactive MAP giving you a clear and impressive learning on education situation across states
The Simplicity of our BridgIT solution will solve your most complex utilization problems.
Smart email analytics for team accountability and sales activity tracking.
Enterprise Level PRI Capacity Monitoring and Automated DR Call Routing