Devpost
Participate in our public hackathons
Devpost for Teams
Access your company's private hackathons
Grow your developer ecosystem and promote your platform
Drive innovation, collaboration, and retention within your organization
By use case
Blog
Insights into hackathon planning and participation
Customer stories
Inspiration from peers and other industry leaders
Planning guides
Best practices for planning online and in-person hackathons
Webinars & events
Upcoming events and on-demand recordings
Help desk
Common questions and support documentation
Sort by:
I heard you were curious about the relationship between land price and population data. So we created a user friendly interface to predict land prices for every neighbourhood in five German cities.
"Additional Distribution center to make Uline's services never ending!!"
Our AI-powered farming platform offers farmers personalized insights and recommendations to optimize their operations and increase their yields.
We analyzed trends across many time and location metrics to find the most dangerous time, place, and time of year in Montreal and judged significance with logistic regression.
Pipeline to classify cellular age based on scATAC-seq data
Analyzing clinical data and make predictions about patients with Sepsis.
With the Montreal Crime dataset and hockey data, we found some correlations between win rates and crime. Are you ready to uncover an unexpected connection between sports and crime?
I am using R to study the impact of parking minimum elimination on housing density in Syracuse. So far, I have mapped out housing density in my control and treatment areas.
Discover your insurance eligibility fast! Briefly describe yourself & we'll assess your case likelihood with potential biases. Get insured confidently!
We analyze crime statistics and data
Pomona Poops features an interactive guide to the restrooms around campus, allowing users to easily locate the closest, suitable toilet for their needs!
Classification and prediction of time-series transcriptomics data
Fake news is a growing problem in today's world, where misinformation can spread rapidly and have serious consequences. Let's figure out the underlying emotional tone of fake news
By putting the total miles between the starting point and destination into the Green Gauge, users are advised on whether to fly, take a train, take a bus, or drive their trip based on CO2 emissions.
Fighting fake news with data-driven insights
MyFoodPal: Empower your gut health journey with personalized IBS symptom tracking, food analysis, and dietary recommendations. Your path to a happier gut starts here!
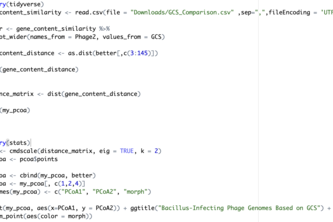
(Prompt 4, Group 1) Distance matrix & PCoA plot
Western's largest datathon from April 5-7th. 3 days of data analysis, networking, and fun!
Public transit system in Riga invokes a lot of emotions - few of them positive. Can we try to tackle some of the problems and improve its efficiency? We sure hope so!
LANE revolutionizes urban planning with accessible smartphone sensor data to pinpoint patterns that amplify unsafe driving behaviors and identifies bottlenecks that cause congestion and accidents.
User friendly, user centered safety system to promote driver welfare in the city of chicago.
Layon allows users to strategically and geographically plan their next career moves while avoiding the "layoff hotspots".
Using statistical methods, we created predictive models accessible via a data visualization dashboard to look at the anticipatory outcomes of natural disasters.
A webapp that lets you explore unique user-generated recipies to try.