Inspiration
We seek to make a data-driven evaluation of the current public transit system in Riga, based on route time and distance efficiency to be able to gouge the current situation and provide recommendations for improvement in the future where possible. We believe that making informed decisions about transit routes can attribute to saving resources, improving the community environment and well-being as well as encouraging the use of public transport.
What it does
Our evaluation is based on "Rigas Satiksme" (the main operator of public transport in Riga) publicly available data sets. Data files gather information about route and transport numbers, the trip registration date and time, the trip direction, the vehicle timetable, the stop schedule, and the number of "e-talons" (e-ticket system in Riga). Thus, the information on the number of users getting on a vehicle at each stop is acquired. Unfortunately, the above-mentioned data sets provide no information about:
- the stop or time when the passenger got off
- the duration of the trip
- the final point of the trip
Our data assumptions:
- All transit runs on schedule
- We define a 'trip' to be a series of transit routes with at least 1 transfer
- Total trip time is no more than 2.5h and transfer time is less than 1.5h
- We assume that the last stop is the final stop of the route
- If the distance between the start and end point is less than 5km, the trip ended on the last transfer (due to the person riding back to the start point)
How we built it
To confirm our suspicion that some existing routes are inefficient, we conducted a short survey of 69 people. The survey results show that 40% of respondents have had uncomfortable situations that require one or more transfers.
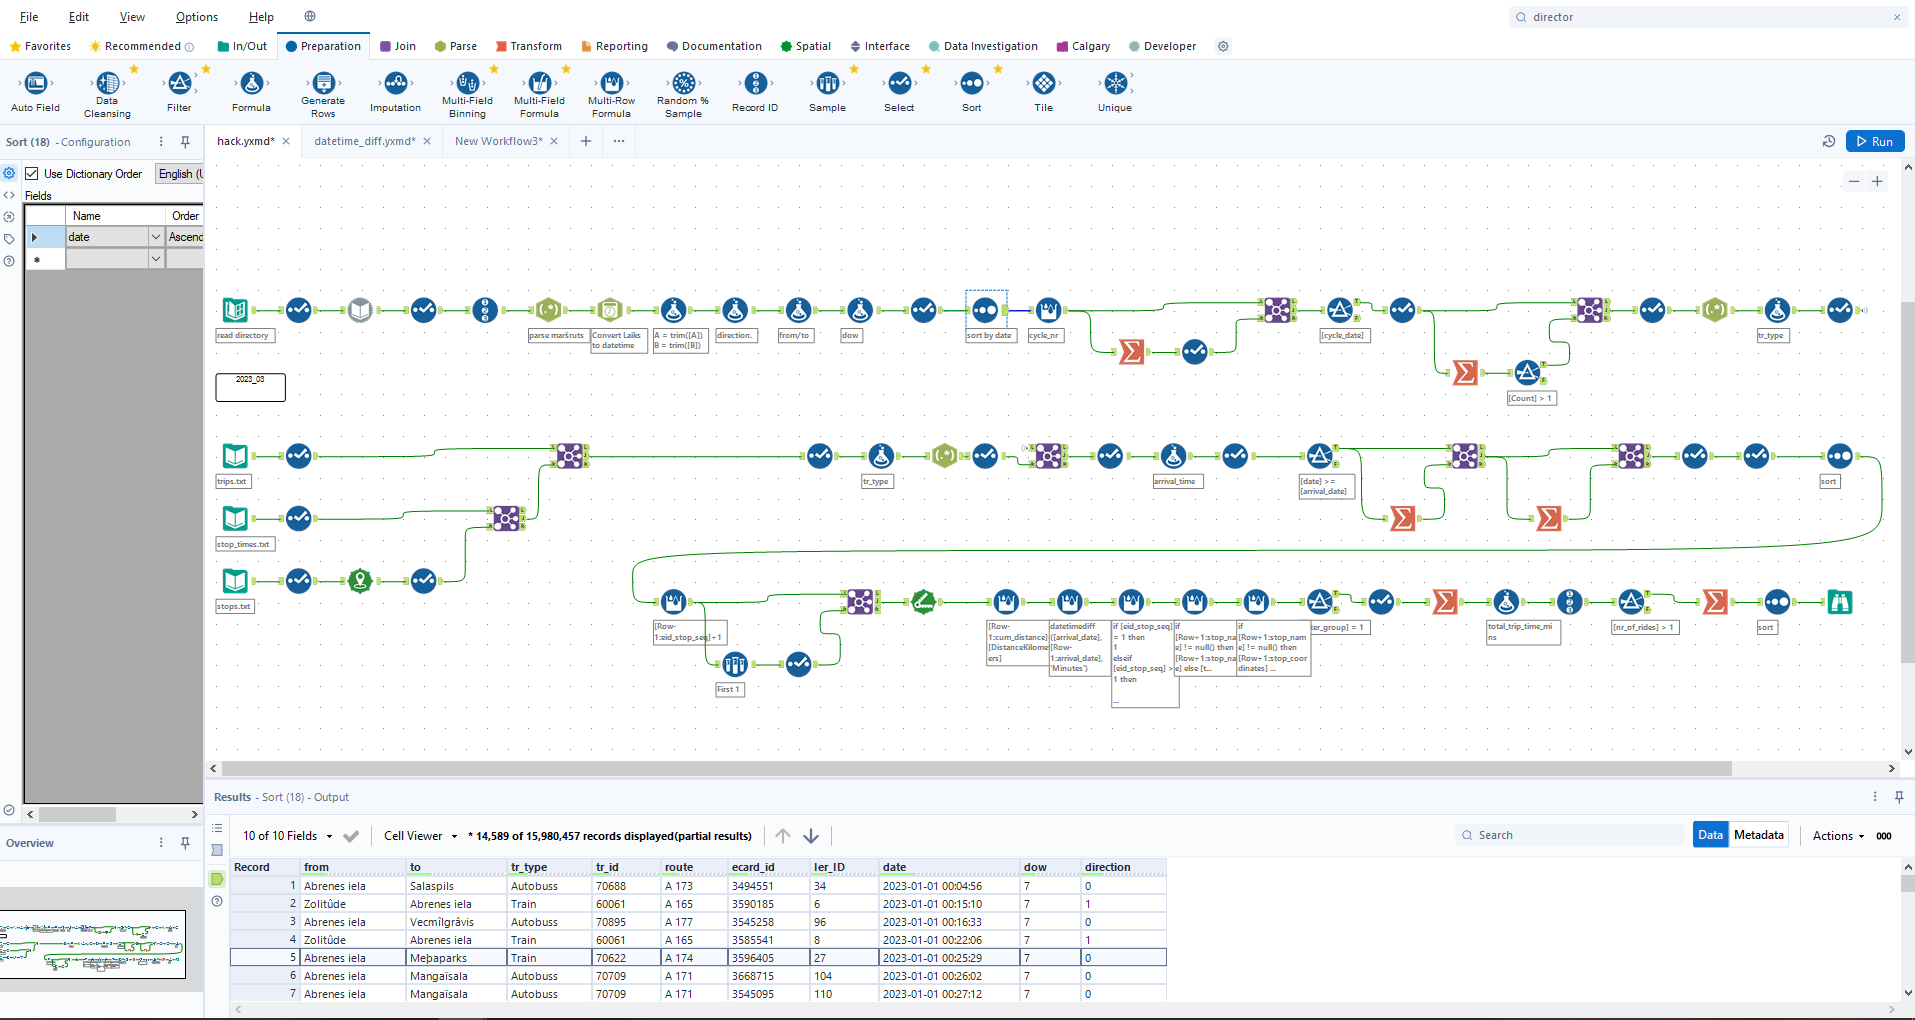
We used big data analysis methods with Alteryx (a leading analytics platform).
Within our analysis, we took all Rigas Satiksme 2023 e-ticket registration data and merged it with the corresponding schedule data to explore public transit user behavior. After having defined a 'trip', we analyzed the most inefficient routes taken by users to get from one Riga region to another.
To showcase our results we used Adobe XD (a design tool for web applications) and created a website draft version. This website is intended to be used by the Riga City council, Rīgas Satiksme, and other urban planners.
Challenges we ran into
Our main challenge data-wise was that the dataset was missing some crucial info that would be needed to conduct analysis without making assumptions. The biggest assumption on our side within the analysis was that the transit users' final destination is the final stop of their route, which is undoubtedly an overestimation of the actual problem.
Other challenges we came across:
- People might not use the most inefficient routes
- Data quality issues - record IDs that are not unique, etc.
- Persons using multiple single-use tickets cannot be included in the analysis (untraceable)
- The definition of a trip is strongly based on our assumptions
Accomplishments that we're proud of
There are three main accomplishments that we are proud of during our time in the hackathon:
- we conducted a survey with a relatively large sample of respondents that confirmed the necessity of our solution
- we managed to develop a substantial initial analysis and knowledge that can be used for further research
- we have produced an astonishing initial website draft for showcasing results, as well as designed a pitch video we love.
However we are most proud not of our technical achievements, but that our time here showed that we have established an amazing and very capable team that learns and works like clockwork!
What we learned
Not always making a more sophisticated analysis is the best solution for data challenges. We have identified how data structure can be redefined to help achieve more reliable results for Rīgas Satiksme. Further, we have gotten the first taste of what it feels like and how it is to work with harsh time and resource restrictions.
It has been a journey where we learn that it's okay to show only the tip of the iceberg - a beautiful result that comes from heaps of underlying work and effort. Lastly, we learned how significant and valuable the support of a knowledgeable field expert is.
What's next for TransitBoost
Several things can be done to further the project:
- implement complementary assumptions to existing data
- connecting with the end users to exchange acquired analyses and propositions on how to improve data collection methodology
- align existing routes with an action plan for the development of Riga
- acquire schedules and timetables from other transit like microbuses and trains
- potentially expand and include in the analysis adjacent territories
Built With
- adobe-illustrator
- adobexd
- alteryx
- r


Log in or sign up for Devpost to join the conversation.