-

Incident Heatmap
-

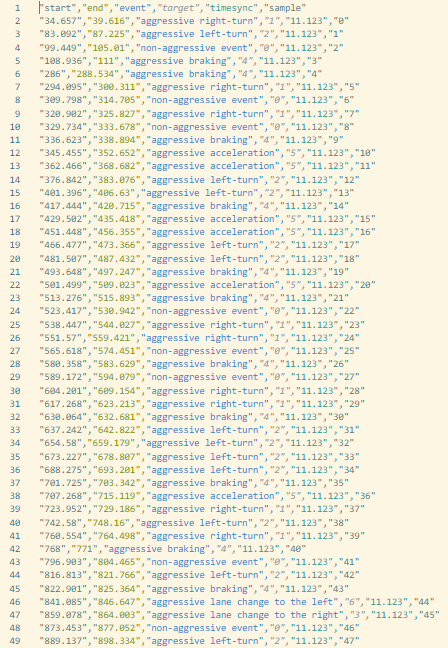
Processed Phone Data
-

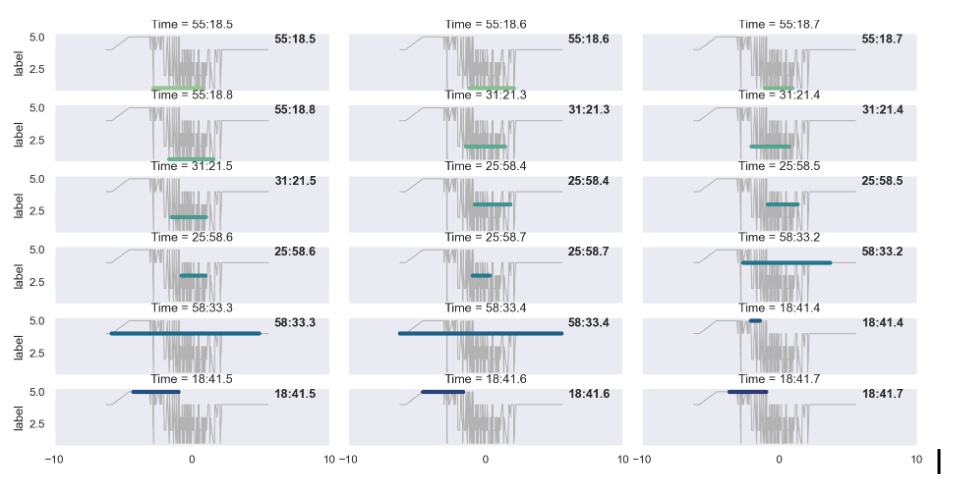
Turning gyroscope data
-

dataset 1
-

dataset 2
-

significance tests
-

statistical testing
-

visualizations


Inspiration
As our team has recently experience serious car accidents due to the clear unintuitive road design and traffic flow, we were inspired to automate the identification of hotspots of dangerous driving patterns and bad road conditions. We noticed that certain stretches of highways, or even local roads that we travelled on, were accident hubs due to sharp turns or sharp breaking that drivers were performing in these areas. We were also inspired by the positive outcomes of traffic automation in our immediate area, as busy intersections performed more instinctively as they were taking statistical models into account.
What it does
LANE takes precise accelerometer, gyroscope, magnetic, and orientational/rotational data from smartphones and analyzes patterns in user data to identify hotspots of unsafe activity. Specifically, all users will be contributing to a large dataset that stores longitudinal, latitudinal, and sensor data to identify which GPS locations have sharp changes in sensor data. While the user is using LANE, we use Mapbox to provide them with navigation and we will visualize areas that might affect the user's vehicle or any areas of dangerous driving on the navigation interface. Road designers will use a separate interface where they can analyze certain sections of their jurisdiction and can identify where community efforts need to be taken to repave roads or redesign roads to remove bottlenecks or improve driver safety with design elements such as shoulders. This all-in-one navigation system supersedes Google/Apple Maps as no app on the market can comprehensively analyze sensor data to characterize driver behavior and road condition to drive actual changes in road plans.
How we built it
The app interface was built using React-Native and TensorFlow JS to integrate all parts of the app. The machine learning utilized common analysis libraries such as sklearn. The use of R to create informative and visually appealing graphs added depth to our project, as we compared the characteristics of the graphs that we produced with R with graphs produced with seaborn to understand which graphs brought out the role of LANE the best.
Challenges we ran into
We ran into challenges when standardizing our data and understanding the context of the metadata provided with the data that we recovered. Although accelerometer data is easily attained from smartphones, there is not a common practice used when describing this data (and all other sensor data) in csvs. Therefore, a lot of our time was spent in using data science to manipulate the structure of our dataframes to fit a standard across all experiments that we found/trials within each experiment.
Accomplishments that we're proud of
We are proud of our integration of Mapbox into our app. We gained experience with APIs and understood how creating heatmaps with Mapbox worked. In addition, we implemented time-dependent machine learning models that were able to extract significant features from millions of datapoints.
What we learned
We gained experience with data science, and learned a lot about csv manipulation. We also learned more about how time series data such as ours should be handled in a slightly different manner when compared to time independent data.
What's next for LANE- Longitudinal Analytics for Road Network Engineering
A large aspect of our project idea was limited by the types of data we could access from Mapbox, as more detailed traffic congestion info and weather info are contained by a paywall. Therefore, in the future, we want to integrate these two factors into our app more as it provides very valuable insight into the factors that affect road design.

Log in or sign up for Devpost to join the conversation.