-
-
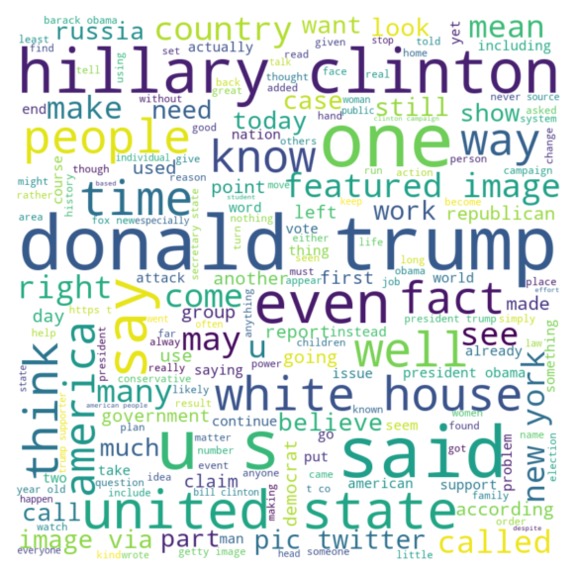
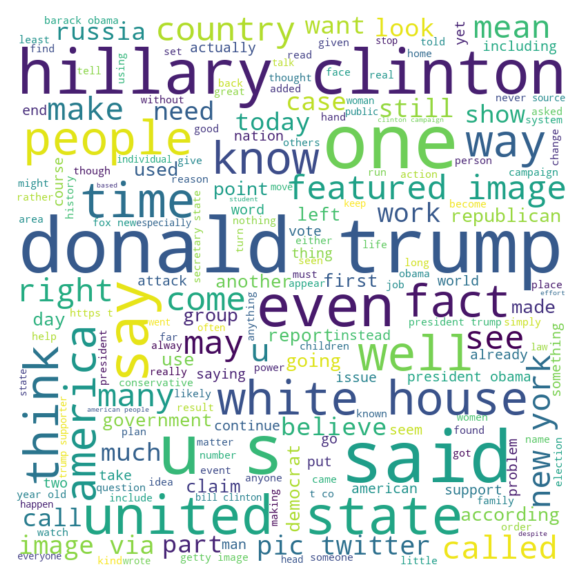
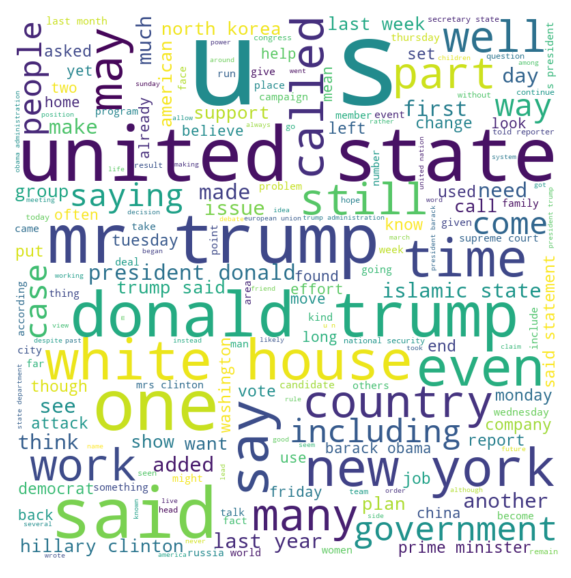
FakeCloud
-
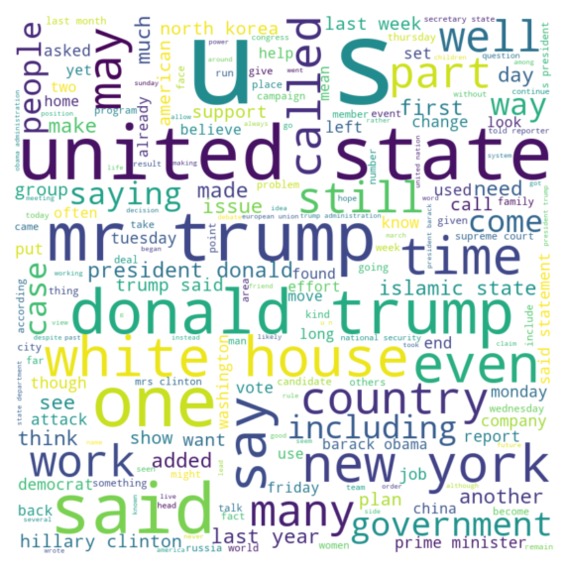
TrueCloud
-
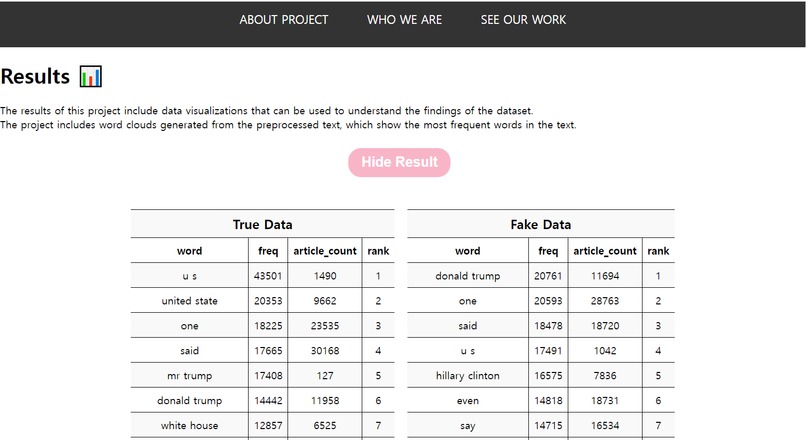
data simplification
-

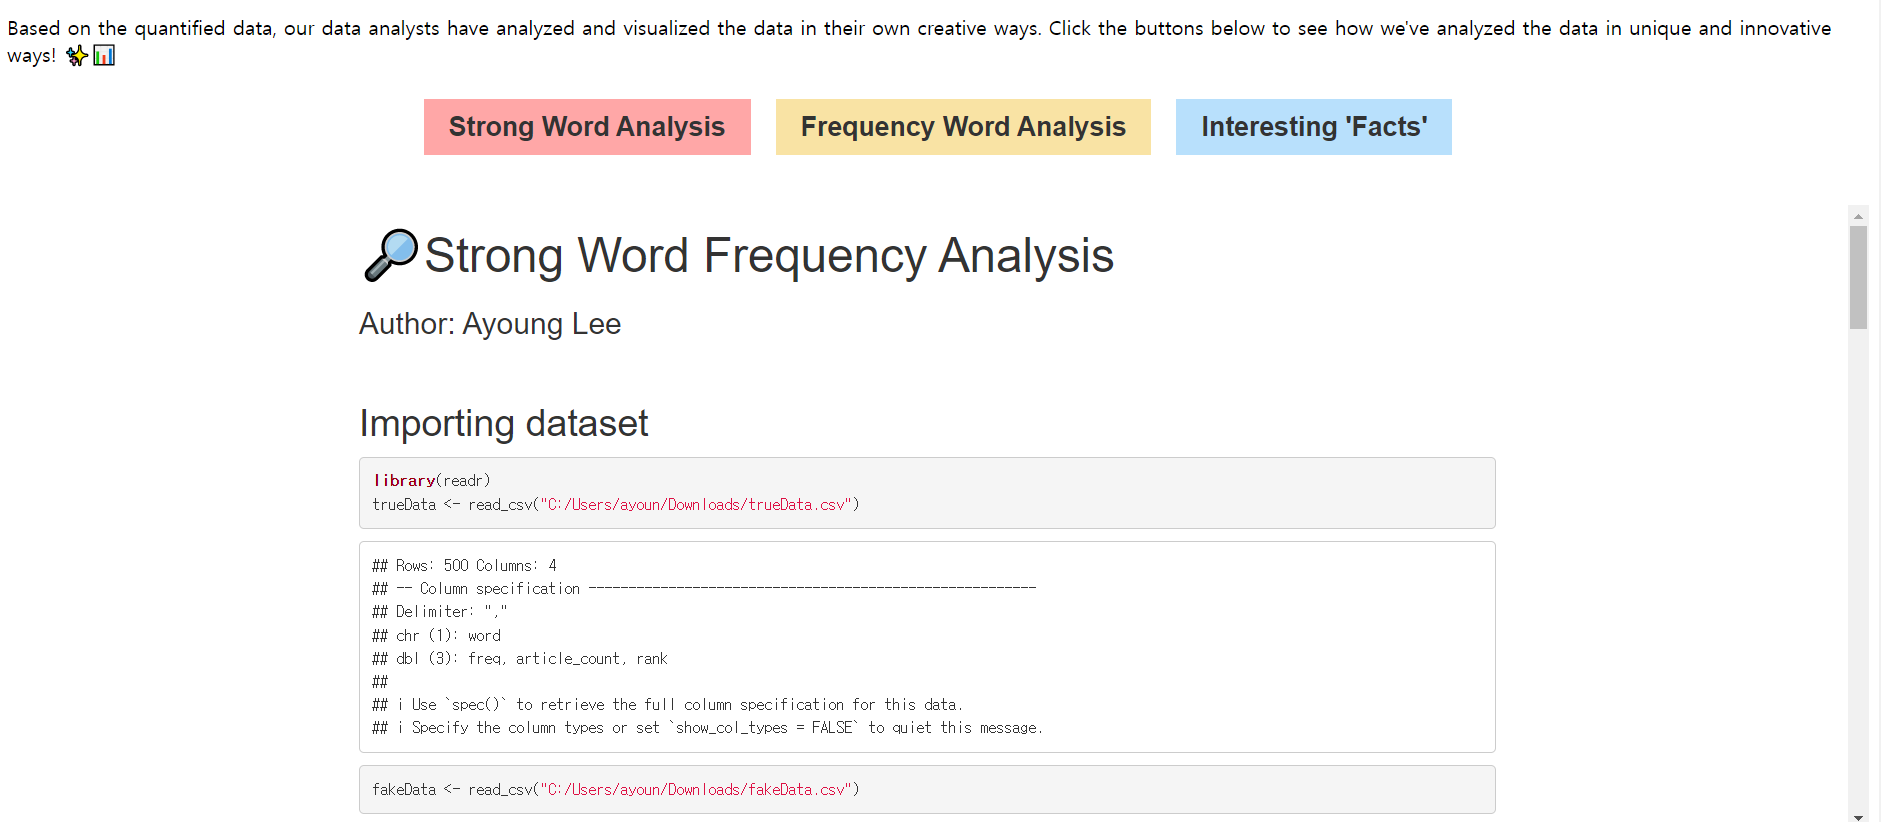
data analysis
Data Analysis Hackathon Project 👩💻
Analyzing Misinformation in News using NLP and Data Visualization
This project was created for the CANIS Data Analysis Hackathon. The task was to create compelling data visualizations that would help others understand the survey results in a meaningful way. The dataset used in this project is available on Kaggle through this link
Visit to see more about this project: https://dayee0318.github.io/about.html
Project Purpose ⛳
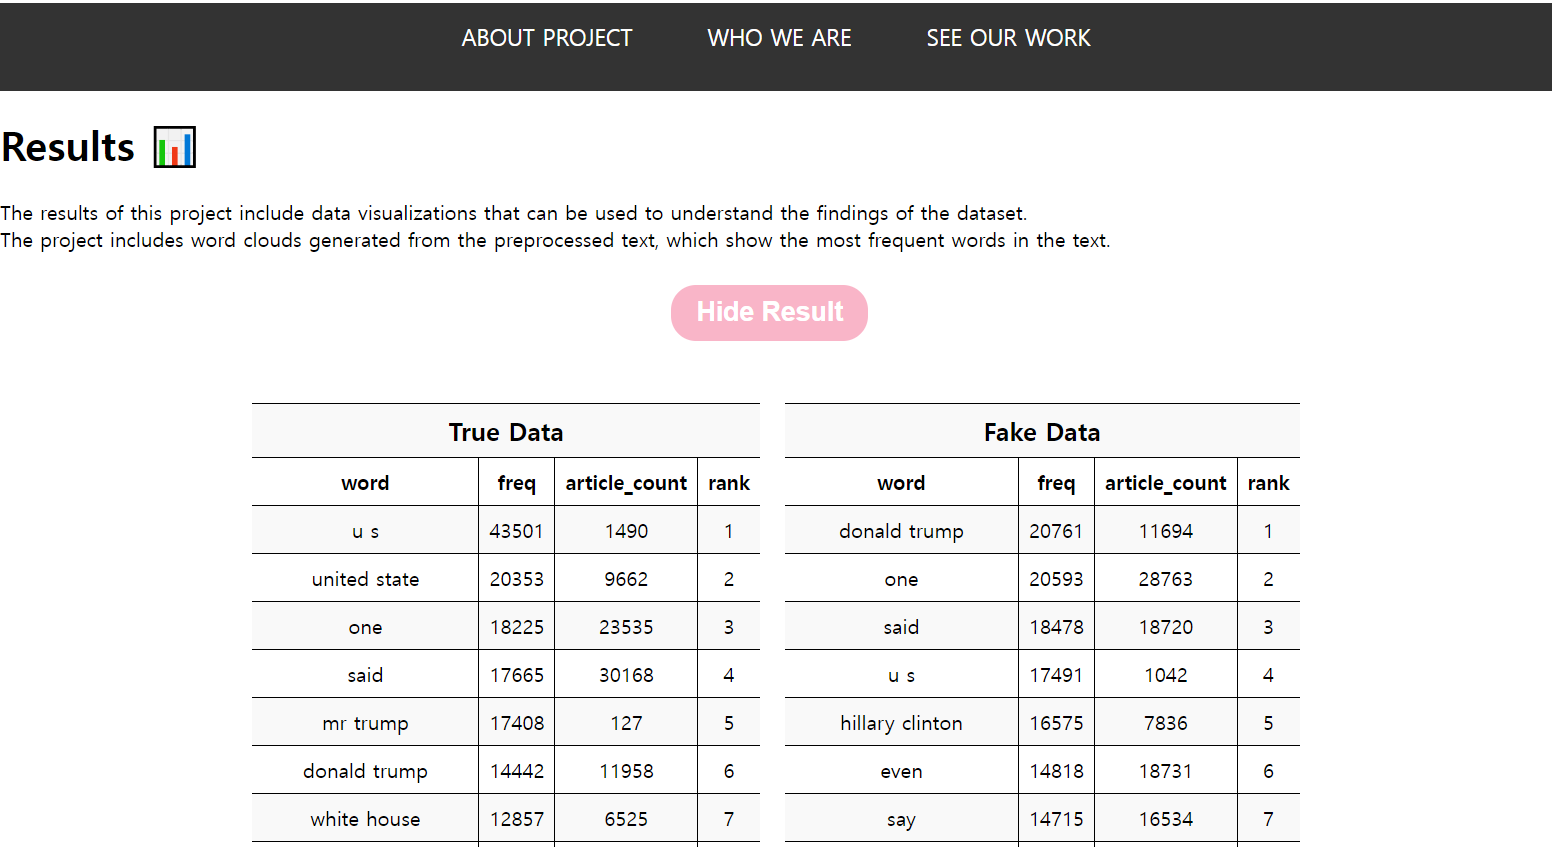
The purpose of this project is to analyze a dataset of news articles and identify the words that are most frequently used in true and fake news. Our goal is to gain insights into the language patterns that are associated with fake news and to develop techniques for detecting and combating misinformation.
To achieve this, we will perform data analysis and NLP techniques on the dataset, extract meaningful insights, and create data visualizations to present our findings in an understandable and meaningful way.
By identifying the key language features of fake news, we hope to contribute to the development of more effective strategies for combating the spread of misinformation and promoting the dissemination of accurate and reliable information.
Project Overview 👓
The project involves data analysis of the misinformation fake news text dataset. The project includes the following steps:
- Preprocessing the dataset by cleaning, formatting, and transforming the data into a suitable format for analysis.
- Performing Natural Language Processing (NLP) techniques, such as tokenization, stemming, and lemmatization, to extract meaningful information from the text data.
- Identifying and removing stop words and other irrelevant information from the dataset.
- Visualizing the results of the analysis using various tools, such as charts, graphs, and interactive dashboards, to make the insights more understandable and accessible to users.
- Developing a web-based platform to present the findings of the analysis and enable users to interact with the data and explore the results in more detail.
Contributors 🙌
- Dayee Lee |
Team Lead, Python developer, Data visualization - Ayoung Lee
Data analyst (R), Data visualization - Daeun Lee
Data analyst (R), Data visualization, Presentor - Youngbin Kim
Data analyst (R), Data visualization
Challenges we ran into
- 🤔 New experience with data analyzing and visualization
- 📚 Busy schedules with final exams and assignments
- 📊 Vast amount of data to deal with
- 💻 Limited computer resources
- 🌎 Analyzing data related to a foreign country (US)
Accomplishments that we're proud of
- 🌐 Created a web page and presented successfully
- 👏 Everyone completed their assigned tasks
- 🎉 New experience but succeed anyway!
What we learned
- 🤓 Choosing and analyzing data can be challenging
- 🔍 Researching topics, comparing and analyzing data, and expressing methods can be difficult
- 🧐 Need for more knowledge and information in data analysis
- 📞 Communication is essential for working together!
What's next for News Misinformation Analysis with NLP and Visualization
- 🌟 Connecting the website with databases, such as SQL, to allow users to easily access desired data
- 🤖 Exploring other analysis programs besides Python and R to delve deeper into the data science world
- 🌍 Expanding our analysis by incorporating other dataset (user comments, real-time trends, page views, reactions...)
- 📈 Developing more advanced visualization techniques to provide more intuitive and interactive data representation for users.
- 📝 Continuing to conduct research to better understand news misinformation, develop new tools, and share our findings with the public.


Log in or sign up for Devpost to join the conversation.