
Inspiration
The plotting of infectious disease patterns. Our love for bacteria phages.
What it does
Plots the visualization of genome distances
How we built it
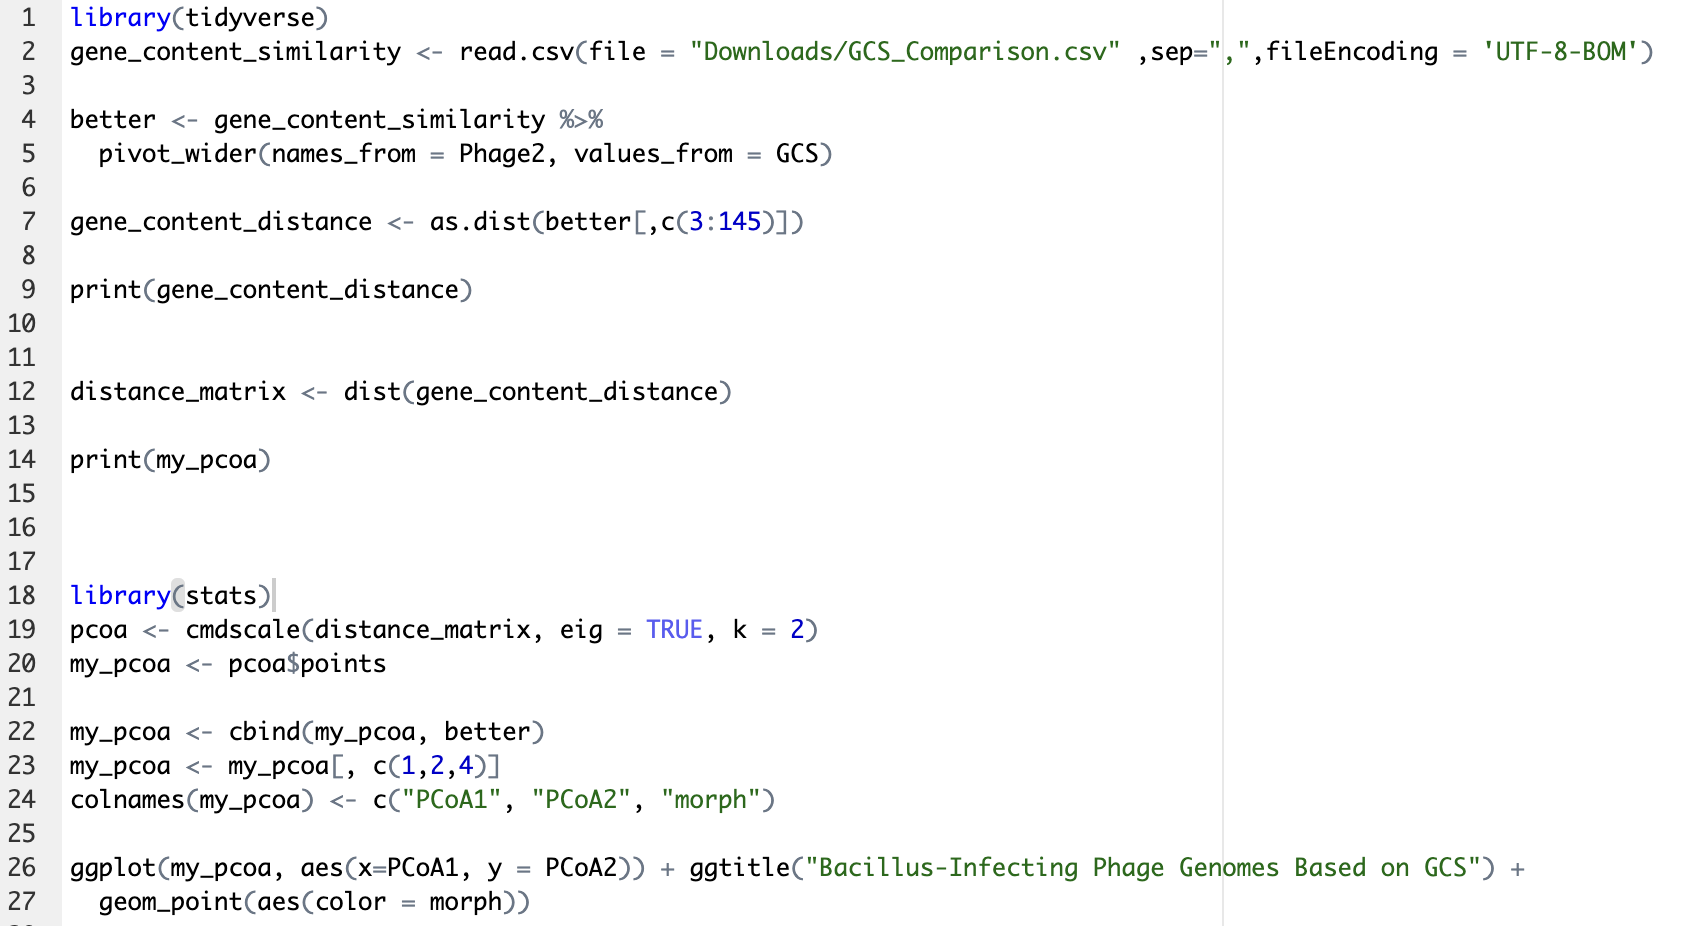
Language R. Created distance matrix then converted it to PCoA pots and created a scatterplot using those points.
Challenges we ran into
We didn't know the package tidyverse existed. Tried creating nested for loops and base R but it didn't work.
Accomplishments that we're proud of
Learning about creating matrixes and creating PCoAs in the language R.
What we learned
After spending 2 hours trying to create the matrix without the packages tidyverse and stats, we learned the value of staying connected and collaborating with other programers in a global health crisis.
What's next for Bacillus-Infecting Phage Genomes Based on GCS
Using more PCoA plots to draw more patterns between different phage genomes or potential diseases.

Log in or sign up for Devpost to join the conversation.