-
-
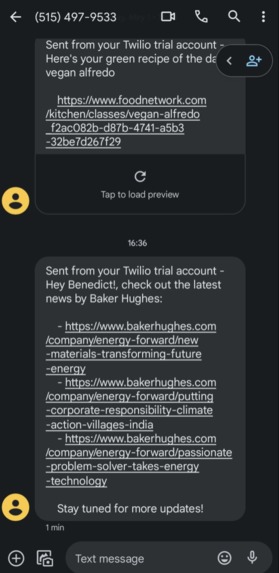
Our Twilio intergration for sending you the latest news
-
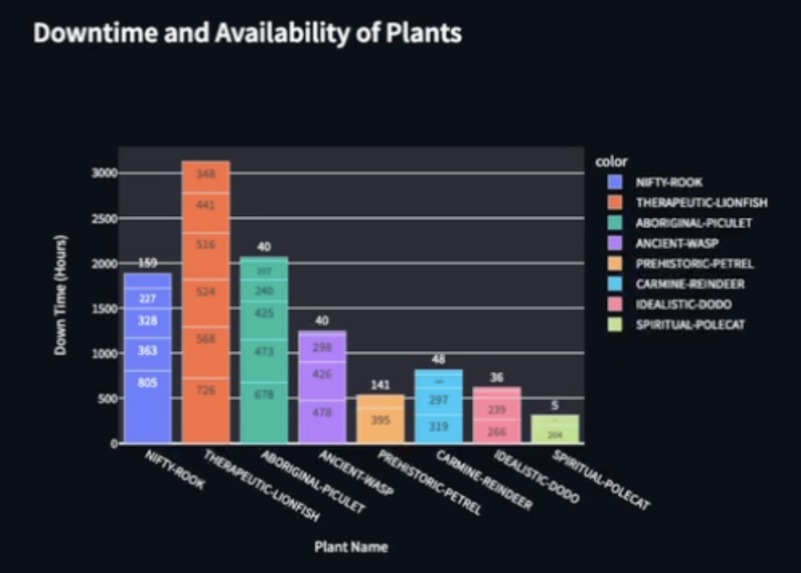
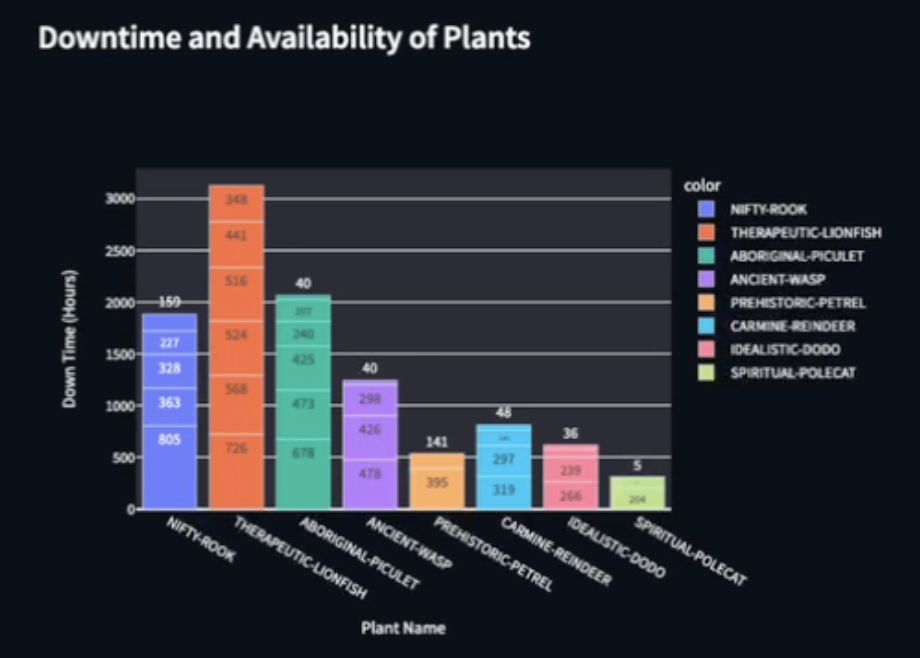
Illustrating the downtime of power plants
-
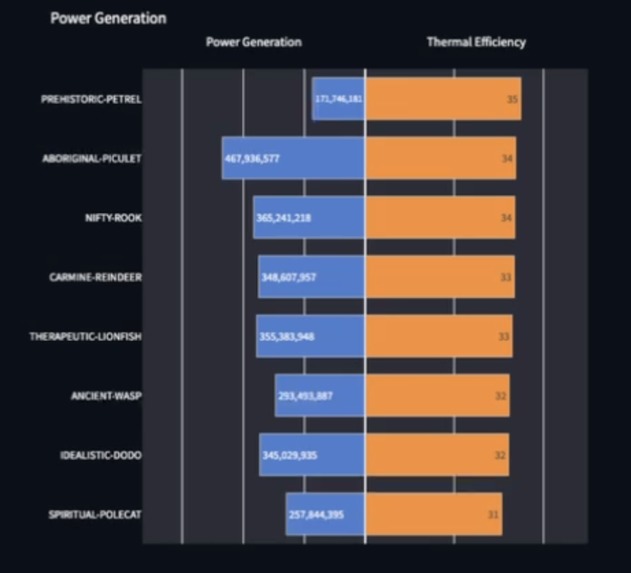
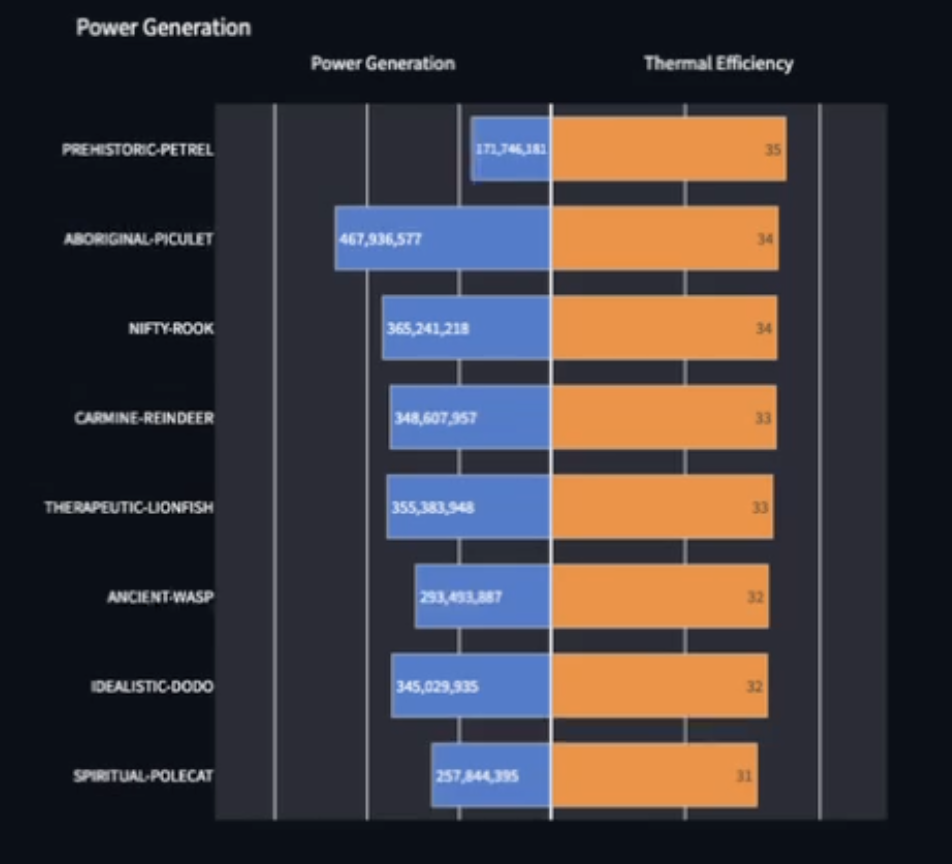
Mapping Power generation to thermal efficiency
Inspiration
We all share a passion for playing with data and messing around with statistics. With our team's diverse skillset, we were ready to tackle some of the datathon challenges, and in particular, Baker Hughes' data visualization challenge caught our attention. It's fun to be able to find and tell a story through all the interesting data. After all, a graph is worth more than a thousand words.
What it does
Our web application aims to answer four specific questions:
- Which plants produce the most carbon dioxide around the world? How about by continent or country?
- Which gas engines are degrading?
- Which plants produce with the highest power? How is the efficiency related to the power?
- Which plant has the best availability? Which plants experienced the most downtime? (helpful for creating maintenance policies)
How we built it
We built it using Cockroach DB , Streamlit, Python (Plotly, numpy, pandas), and Twilio
- Cockroach DB - as data warehouse to store raw data
- Streamlit - as a frontend UI framework
- Python - as a general programming language
- Twilio - as a messaging tool to send latest news updates from Baker Hughes
- Domain.com - swooshswoosh.tech
Challenges we ran into
We struggled with connecting CockroachDB for storing our data. We initially attempted to create a concatenated version of our dataset in our local environment and create a table on CockroachDB. During the data upload step, we realized that CockroachDB would not allow us to read tables locally through the copy command. As a result, we had to have our dataset uploaded to a cloud storage platform such as GCP or AWS S3. Our dataset was uploaded to S3, but CockroachDB was unable to read the data through cloud storage. We fiddled through our environment settings and tried various ways of connecting and uploading our data to find a method that finally worked. We learned a lot from debugging our code and fixing bugs as we found them along the way.
Accomplishments that we're proud of
Our team was located all around the world, ranging from Southeast Asia to New York, and Iowa. We're proud of being able to formulate a solid plan and distribute tasks. Overall we're also really proud of being able to find a creative way to integrate a use case for Twilio in our web application. Not all of our team members have a computer science or statistics, so we all learned a lot, from learning how to set up our local environments, to learning how to identify and measure Key Performance Indicators from our data.
What we learned
- It was our first time using CockroachDB in any of our projects. While it was a steep learning curve, we're glad that we were able to get past this challenge. We also learned to use Plotly for our graphs. About half of our team have never used Plotly before, and we found pair programming to be an extremely conducive learning environment.
- Our team also experimented with a new perspective with data analysis. Instead of taking technical measurements such as mean and standard deviation and jumping straight to plotting charts to summarize statistics, we approached the problem in a hypothesis-driven manner. We learned to first look at the dataset and think about what we each found interesting. We all were able to come up with different questions to explore, some of which included looking at locational, seasonal, and correlation attributes. We felt that by using this method, our analysis felt a little more human since we found a purpose and a problem to solve.
What's next?
We plan on expanding our visualization capabilities to ingest live turbine and engine data from Baker Hughes' globally distributed power plants. With additional data, we also want to be able to detect anomalies, power, and low thermal efficiencies in the future.
Prize Categories
Best use of Twilio: We noticed that Baker Hughes does not have a newsletter to keep their fans updated with the cutting-edge work they do gasp. We decided to use Twilio to help them build one. Hopefully they like it!
Best use of CockroachDB: CockroachDB is our data storage and querying platform for storing the datasets provided to us by Baker Hughes. We were able to explore many exciting aspects of CockroachDB's new features and how accessible it was to query large datasets.
Baker Hughes' Gas Turbine Data Visualization Challenge : Our project describes everything we want to say!
Log in or sign up for Devpost to join the conversation.